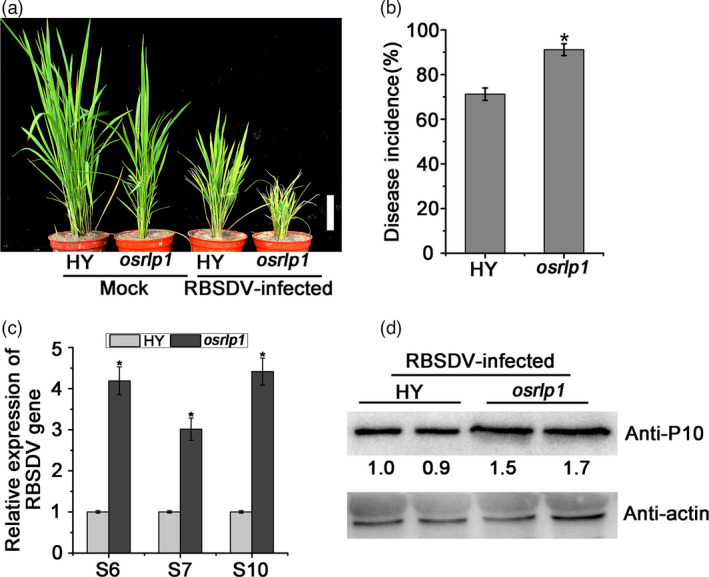
Figure 2.

The effect of RBSDV infection on OsRLP1 T‐DNA mutant plants. (a) The phenotypes of RBSDV‐infected and mock‐inoculated plants photographed at 30 dpi. White bar represents 5 cm. (b) The viral incidence in HY (WT) and osrlp1 (OsRLP1 T‐DNA mutant) plants at 30 dpi. Disease incidence is the percentage of RBSDV‐infected plants based on the numbers of healthy and diseased plants as determined by RT‐PCR. (c) The relative expression levels of RBSDV S6, S7 and S10 genes in RBSDV‐infected HY and osrlp1 plants as detected by RT‐qPCR at 30 dpi. UBQ5 was used as the internal reference gene to normalize the relative expression. Values are the means ± SD of 3 biologically independent samples. *Significant difference at P < 0.05 from Fisher's LSD test. (d) The expression level of viral P10 protein in RBSDV‐infected HY and osrlp1 plants as detected by Western blot. Actin and its corresponding antibody were used as a reference.
