Figure 4.

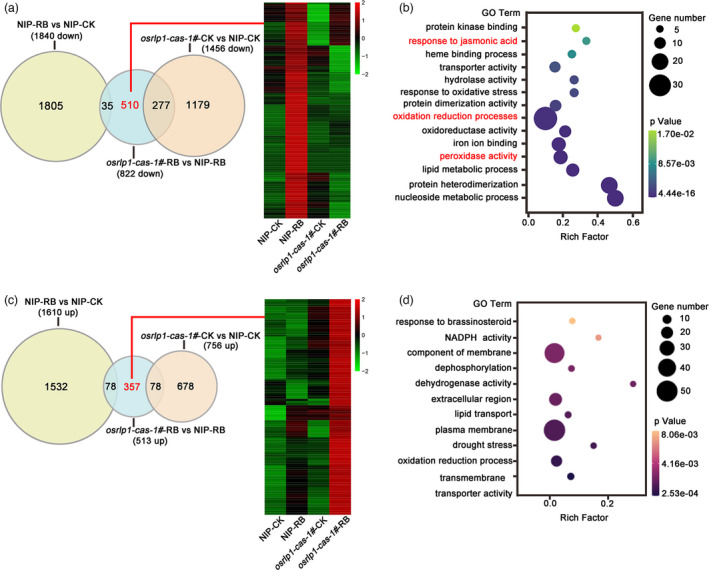
RNA‐seq analyses of NIP and osrlp1‐cas‐1# plants in response to RBSDV infection. (a), (c) Venn diagrams showing overlaps of down‐regulated (a) or up‐regulated (c) differentially expressed genes in NIP‐RB vs NIP‐CK, osrlp1‐cas‐1#‐RB vs NIP‐RB and osrlp1‐cas‐1#‐CK vs NIP‐CK samples at 30 dpi. The heat maps show hierarchical cluster analysis of the 510‐down or 357‐up (genes labelled in red) differentially expressed genes in NIP or osrlp1‐cas‐1# plants under mock or RBSDV inoculation. All differentially expressed genes were selected using cut‐off P‐value <0.05 and fold‐change >2 compared with controls. Data were collected from three biological replicates, each containing a pool of three plants. RB, RBSDV‐infected plants; CK, control plants. (b), (d) the gene ontology (GO) enrichment analyses of 510‐down or 357‐up (genes labelled in red) in (a) and (c). Oxidation–reduction processes and plant defence genes are labelled in red.
