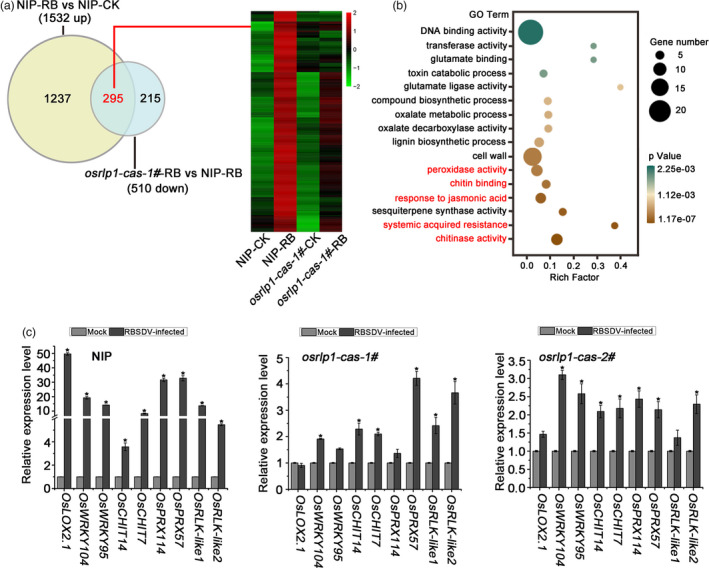
Figure 5.

The interaction between NIP and osrlp1‐cas‐1# plants in response to RBSDV infection by transcriptome analyses. (a) Venn diagrams showing overlaps of 1532 up‐regulated genes in NIP‐RB vs NIP‐CK and 510 down‐regulated genes in osrlp1‐cas‐1#‐RB vs NIP‐RB. The heat maps show hierarchical cluster analysis of the 295 (genes labelled in red) differentially expressed genes in NIP or osrlp1‐cas‐1# plants under mock or RBSDV inoculation. All differentially expressed genes were selected using cut‐off P‐value <0.05 and fold‐change >2 compared with controls. Data were collected from three biological replicates, each containing a pool of three plants. RB, RBSDV‐infected plants; CK, control plants. (b) The gene ontology (GO) enrichment analyses of 295 (genes labelled in red) in (a). Plant defence and systemic acquired resistance are labelled in red. (c) The accuracy of the transcriptome data for these differentially expressed genes described in (a) was verified by RT‐qPCR in RBSDV‐infected NIP, osrlp1‐cas‐1# and osrlp1‐cas‐2# plants at 30 dpi. UBQ5 was used as the internal reference gene to normalize the relative expression. Values are the means ± SD of 3 biologically independent samples. *Significant difference at P < 0.05 from Fisher's LSD test.
