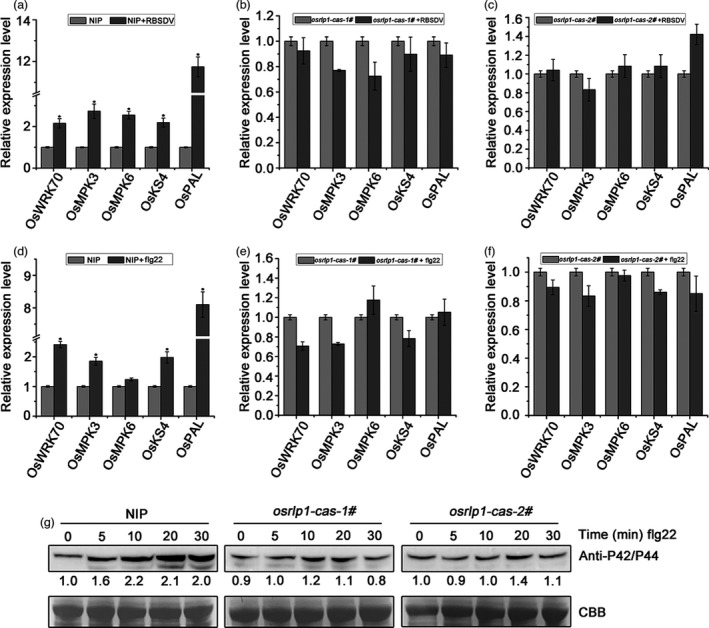
Figure 6.

OsRLP1 modulates the expression of PTI‐related genes and MAPK cascades. (a) The relative expression levels of the PTI‐ and MAPK‐related genes in RBSDV‐infected NIP plants at 30 dpi assessed by RT‐qPCR. UBQ5 was used as the internal reference gene to normalize the relative expression. Values are the means ± SD of 3 biologically independent samples. *Significant difference at P < 0.05 from Fisher's LSD test. (b), (c) The relative expression levels of the PTI‐ and MAPK‐related genes in RBSDV‐infected osrlp1‐cas‐1# and osrlp1‐cas‐2# plants at 30 dpi assessed by RT‐qPCR. UBQ5 was used as the internal reference gene to normalize the relative expression. Values are the means ± SD from 3 biologically independent samples. *Significant difference at P < 0.05 from Fisher's LSD test. (d) The relative expression levels of the PTI‐ and MAPK‐related genes in response to flg22 in NIP plants at assessed by RT‐qPCR. NIP plants were infiltrated with 10 μm flg22, and leaves were collected 30 min post‐infiltration for transcript analysis. UBQ5 was used as the internal reference gene to normalize the relative expression. Values are the means ± SD from 3 biologically independent samples. *Significant difference at P < 0.05 from Fisher's LSD test. (e), (f) the relative expression levels of the PTI‐ and MAPK‐related genes and MAPK in response to flg22 in osrlp1‐cas (1# and 2#) plants assessed by RT‐qPCR. osrlp1‐cas plants were infiltrated with 10 μm flg22, and leaves were collected 30 min post‐infiltration for transcript analysis. UBQ5 was used as the internal reference gene to normalize the relative expression. Values are the means ± SD from 3 biologically independent samples. *Significant difference at P < 0.05 from Fisher's LSD test. (g) MAPK activation in NIP and osrlp1‐cas‐1# rice leaves after exogenous 10 μm flg22 treatment for 0, 5, 10, 20 or 30 min. Anti‐p42/44 antibody was used for Western blotting. At least two biological replicates were conducted for each experiment. Total proteins were stained with Coomassie brilliant blue (CBB) to show equal loading.
