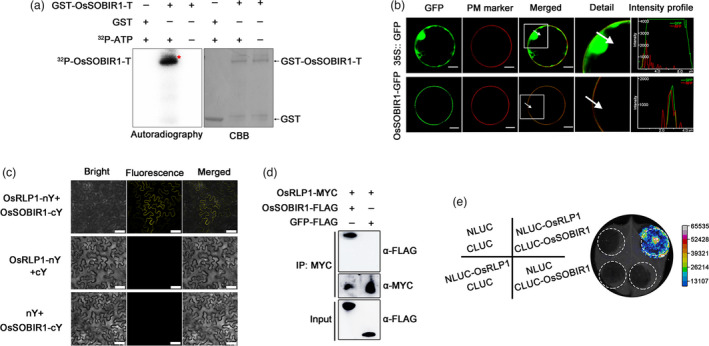
Figure 7.

OsRLP1 interacts with OsSOBIR1 protein. (a) In vitro phosphorylation assay showing that OsSOBIR1 is a kinase. GST‐OsSOBIR1‐T is the region 151‐510 aa of OsSOBIR1 (which contains the integral kinase domain) fused to the GST tag. GST served as a negative control in the in vitro kinase assay. 32P‐ATP: [λ‐32P] ATP. The phosphorylated proteins were visualized by autoradiography. (b) Subcellular localization of OsSOBIR1 protein in rice protoplasts. OsSOBIR1‐eGFP was transiently expressed in rice protoplasts with the construct 35S:: eGFP as negative control. PM marker: Plasma Membrane marker. Merged images show co‐localization of OsSOBIR1‐eGFP and the plasma membrane. The white square in the merged image is magnified as a detailed picture. White arrows indicate the region of interest (ROI) and intensity profiles show the pixels grey value across the ROI in the eGFP and RFP channels. White bar represents 10 μm. *Significant difference at P < 0.05 frp, Fisher's LSD test. (c) BiFC assays showing the interaction between OsRLP1 and OsSOBIR1 in N. benthamiana cells. White bar represents 25 μm. (d) Co‐IP assays indicate that OsRLP1 interacts with OsSOBIR1 in rice protoplasts. Total proteins were extracted and immunoprecipitated by anti‐MYC magnetic beads. The coimmunoprecipitated proteins were probed with an anti‐FLAG antibody. (e) Luciferase complementation imaging (LCI) assays display OsRLP1 protein interacts with OsSOBIR1 protein in N. benthamiana leaves. NLUC and CLUC are negative controls.
