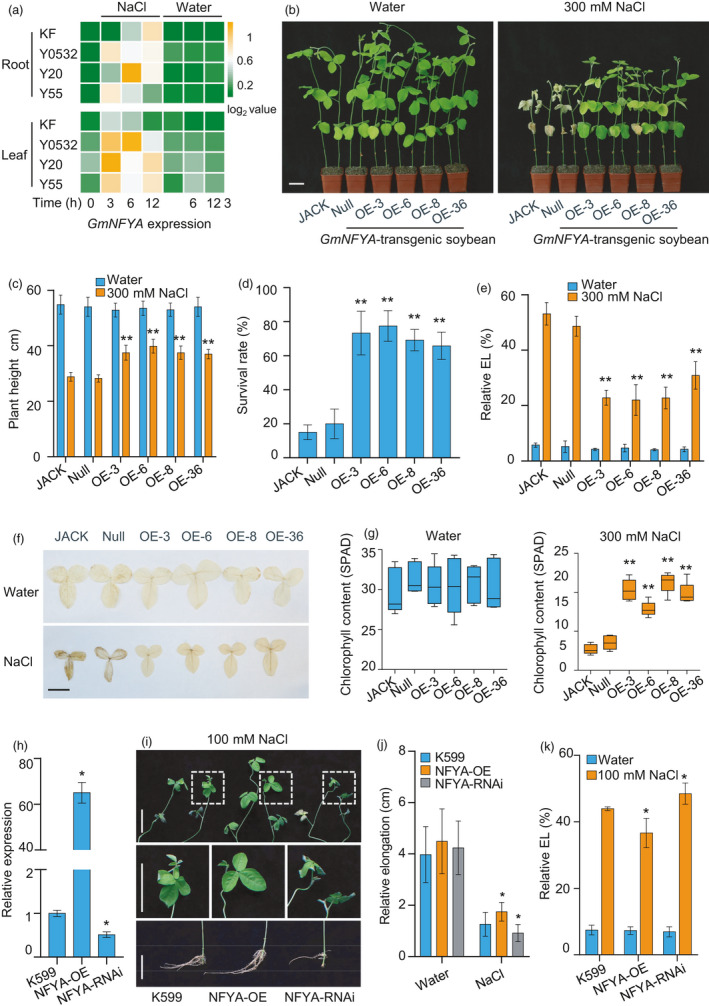
Figure 1.

GmNFYA positively regulates soybean salt tolerance. (a) GmNFYA expression in response to salt stress in cultivar Kefeng1 (KF), and wild soybean Y0532, Y55 and Y20. (b) Overexpression of GmNFYA improves salt tolerance of stable transgenic soybean plants. Scale bar = 5 cm. (c) Plant heights of different transgenic lines after 300 mM NaCl treatment for 7 d. Bars indicate SD (n = 6). (d) Survival rates of control and GmNFYA‐overexpressing plants after NaCl treatment. Error bars indicate SD (n = 3). (e) Relative electrolyte leakage of trifoliolate leaves from different transgenic lines after NaCl treatment. Bars indicate SD (n = 4).(f) DAB staining of the first trifoliolate leaves from transgenic soybean plants after water or salt treatment. The brown colour indicates ROS level in each leaf. Bar = 5 cm. (G) Chlorophyll contents of the first trifoliate leaves from various soybean plants grown in water condition or under NaCl treatment. Bars indicate SD (n = 5). (h) Expression of GmNFYA in transgenic hairy roots. K599 indicates soybean plants with control hairy roots generated from A. rhizogenis strain K599. NFYA‐OE indicates soybean plants with transgenic hairy roots overexpressing GmNFYA. NFYA‐RNAi indicates soybean plants with transgenic hairy roots showing reduced expression of GmNFYA. Bars indicate SD (n = 3). (i) Phenotype of plants with GmNFYA‐transgenic hairy root after salt treatment. Scale bar = 5 cm. (j) Relative elongation of different transgenic hairy roots after NaCl treatment for 3 d. Bars indicate SD (n = 30). (k) Relative electrolyte leakage of trifoliolate leaves from different plants with transgenic hairy root. Bars indicate SD (n = 4). Asterisks indicate significant difference compared with the corresponding controls (*, P < 0,05; **, P < 0.01)
