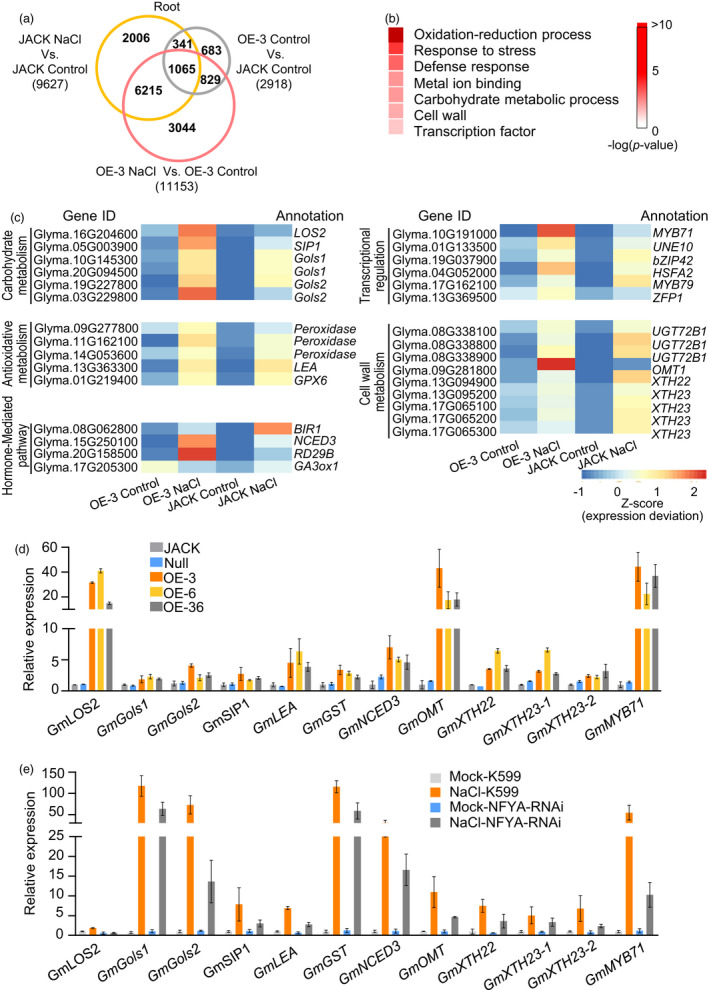
Figure 2.

GmNFYA is involved in the regulation of the expression of salt‐responsive genes. (a) Venn diagram showing differentially expressed genes (DEGs) in root samples. Common DEGs were analysed between three ways of comparison: GmNFYA‐OE‐3 transgenic soybean (OE‐3_Control) versus wild‐type JACK (JACK_Control), NaCl‐treated JACK (JACK_NaCl) versus non‐NaCl‐treated JACK (JACK_Control) and NaCl‐treated transgenic soybean (OE‐3_NaCl) versus non‐NaCl‐treated transgenic soybean (OE‐3_Control). (b) GO terms that were statistically enriched in GmNFYA‐regulated genes involved in salt response, which were identified using the 1065 common DEGs in (a). (c) Heatmap of DEGs in the GO terms of carbohydrate metabolism, antioxidative metabolism, hormone signalling, cell wall metabolism and transcriptional regulation. (d) Expression levels of the salt‐responsive genes in stable GmNFYA‐overexpression transgenic soybean plants. Error bars indicate SD (n = 3). (e) Expression levels of the salt‐responsive genes in plants with GmNFYA‐RNAi transgenic hairy roots under water and salt‐stress condition. Error bars indicate SD (n = 3)
