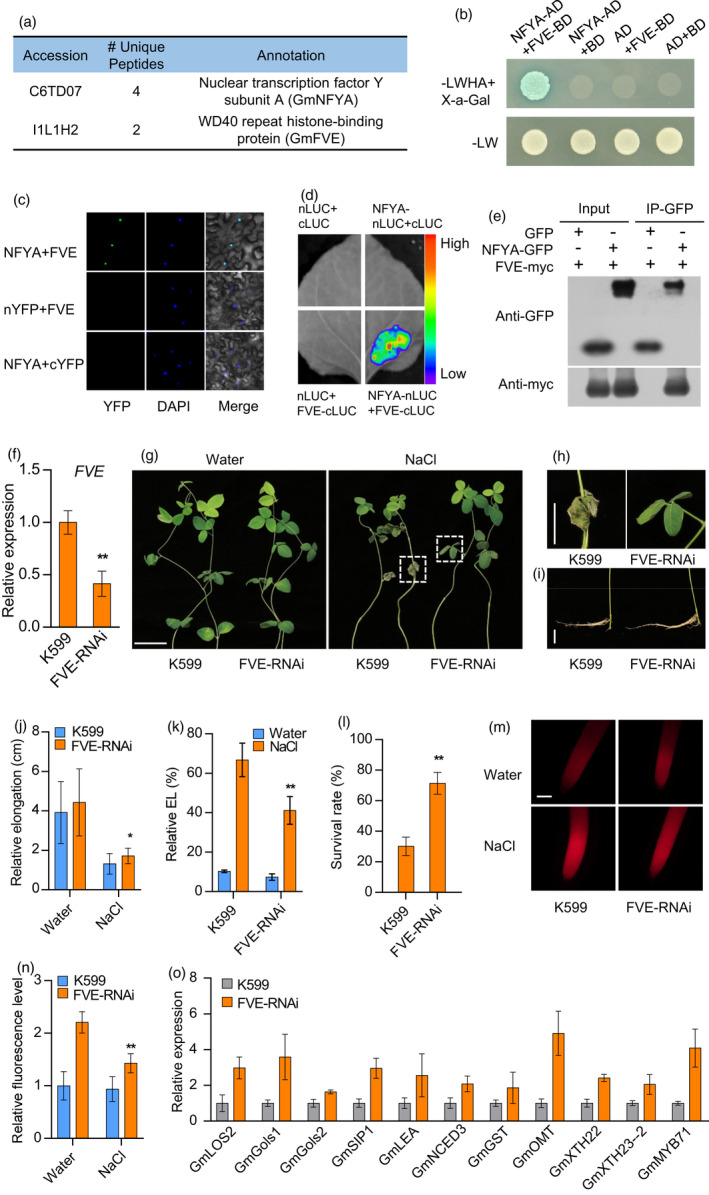
Figure 3.

GmNFYA‐interacting protein GmFVE acts as a negative regulator of salt response. (a) Immunoprecipitation–mass spectrometry (IP‐MS) showing GmFVE is the interacting protein of GmNFYA. (b) GmNFYA interacts with GmFVE in a yeast two‐hybrid assay. ‐LWHA+X‐a‐Gal indicates Leu, Trp, His, Ade and X‐a‐Gal drop‐out plates. –LW indicates Leu and Trp drop‐out plates. (c) BiFC analysis of the interaction between GmNFYA and GmFVE in N. benthamiana leaf. (d) Split‐luciferase complementation assay of GmNFYA and GmFVE interaction in N. benthamiana leaf. (e) Co‐immunoprecipitation (Co‐IP) assay of GmNFYA and GmFVE interaction in vivo. (f) Expression of GmFVE in GmFVE‐RNAi transgenic hairy roots. FVE‐RNAi indicates transgenic hairy roots with reduced expression of GmFVE. Bars indicate SD (n = 3). (g) Phenotype of plants with GmFVE‐RNAi transgenic hairy roots after 100 mM NaCl treatment for 3 d. Scale bar = 5 cm. (h and i) The growth of leaves (h) and roots (i) from the plants with salt stress in (g). Bar = 2 cm. (j) Elongation of GmFVE‐RNAi transgenic hairy roots after 80 mM NaCl treatment for 3 d. Bars indicate SD (n = 30). (k) Relative electrolyte leakage (EL) of trifoliolate leaves from the plants with GmFVE‐RNAi hairy roots. Bars indicate SD (n = 4). (l) Survival rates of the plants with GmFVE‐RNAi transgenic hairy roots after 100 mm NaCl treatment for 3 d. Bars indicate SD (n = 3). (m and n) ROS staining (m) and ROS levels (n) of the transgenic and control roots after salt treatment for 6 h. Scale bar = 50 μm. Bars indicate SD (n = 6). (o) Expression of GmNFYA‐regulated genes in GmFVE‐RNAi transgenic hairy roots. Error bars indicate SD (n = 3). Asterisks indicate significant difference compared with the corresponding controls (*, P < 0,05; **, P < 0.01)
