
Figure 6.
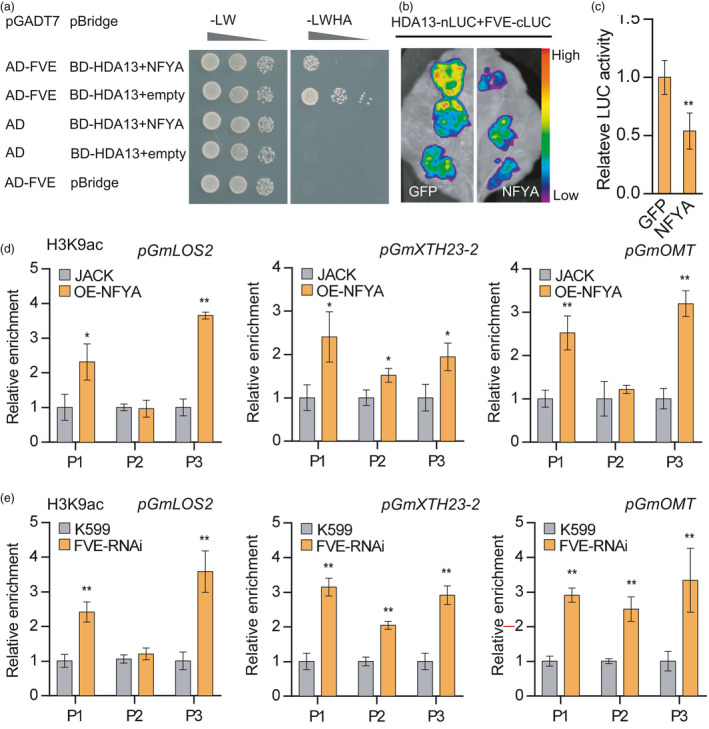
GmNFYA and GmFVE modulate histone H3 acetylation level at the chromatins of their target genes. (a) Yeast three‐hybrid assay analysing the GmFVE and GmHDA13 interaction in the presence or absence of co‐expressed GmNFYA. Yeasts cells were grown on SD‐Ade‐His‐Leu‐Trp medium to test the interaction and competition, respectively. (b) Split‐luciferase complementation assay showing the interaction of GmFVE and GmHDA13 is weakened by co‐expressed GmNFYA in N. benthamiana leaves. (c) Quantitative analysis of luminescence intensity in B. Bars indicate SD (n = 6). (d and e) ChIP analysis of H3K9ac levels at the promoter of GmLOS2, GmXTH23‐2 and GmOMT in stable GmNFYA‐overexpressing transgenic plants (d) and plants with GmFVE‐RNAi hairy roots (e). OE‐NFYA indicates stable GmNFYA‐overexpression transgenic soybean plants. FVE‐RNAi indicates plants with transgenic hairy roots showing reduced level of GmFVE. The indicated genomic regions (See Figure 4a) were analysed by ChIP‐qPCR. Error bars indicate SD (n = 3). Asterisks indicate significant difference compared with the corresponding controls (*, P < 0.05; **, P < 0.01)