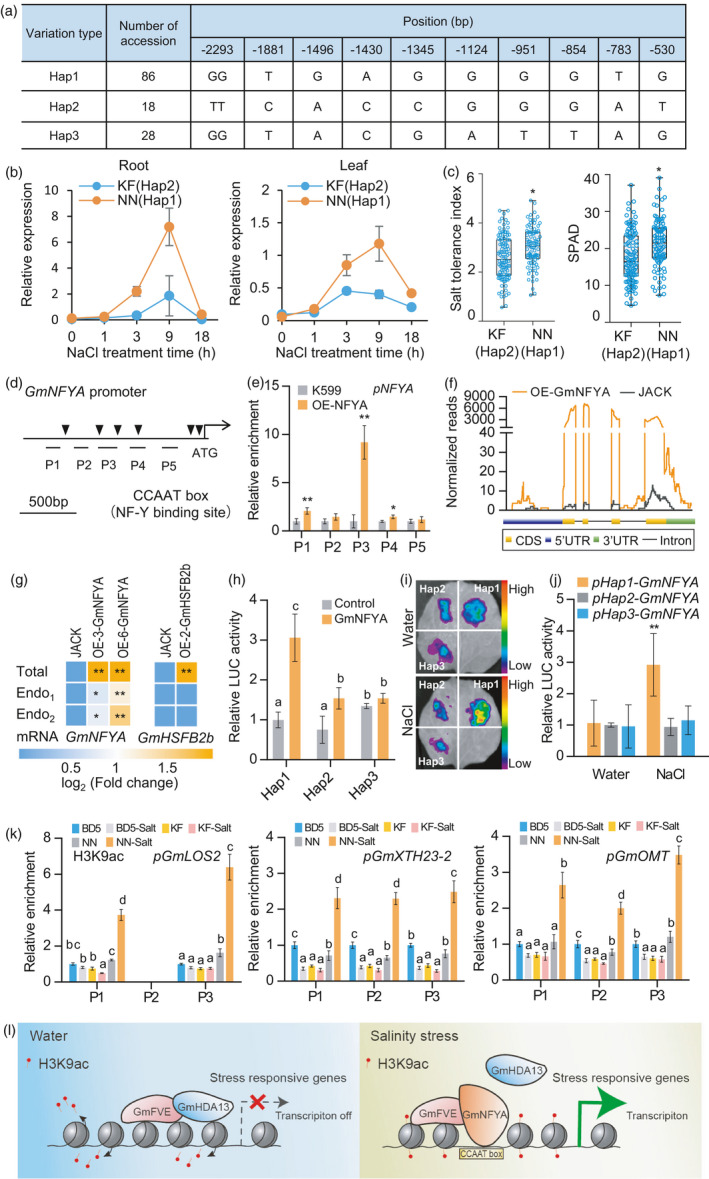
Figure 7.

Correlation between GmNFYA expression and salt tolerance in cultivated soybeans. (a) Haplotype variation of cultivated soybeans in the GmNFYA promoter region. The start codon site is set at the ‘0’ position. (b) GmNFYA expression in response to salt stress in leaf and root of Kefeng1 (KF, Hap 2) and Nannong 1138‐2 (NN, Hap 1). Bars indicate SD (n = 3). (c) Salt tolerance index and chlorophyll content in the recombinant inbred lines (RILs) derived from a cross between NN (Hap 1) and KF (Hap2). The numbers of lines with Hap1 and Hap2 are 96 and 109, respectively. SPAD represents the chlorophyll content in the leaves. (d) Distribution of CCAAT box in the promoter region of GmNFYA. P1‐P5 are used in the following ChIP‐qPCR analysis. (e) ChIP‐qPCR assay showing that GmNFYA associates with its own promoters in GmNFYA‐GFP transgenic hairy root. Bars indicate SD (n = 3). (f) RNA‐seq analysis showing normalized reads of GmNFYA transcript in coding region (CDS) and untranslated region (UTR) in stable GmNFYA‐OE‐3 transgenic soybean and JACK roots. (g) Heatmaps showing the activation of GmNFYA on the endogeous GmNFYA gene examined by RT‐qPCR. Specific primers are designed at the coding region (Total) and 3’‐UTR (Endo1 and Endo2) of GmNFYA gene to distinguish total and endogenous GmNFYA expression. Stable GmHSFB2b transgenic plants are used as controls. (h) Activation ability of GmNFYA on the promoters of three haplotypes in Arabidopsis protoplast transient expression assay. Bars indicate SD (n = 3). (i) Promoter activity of GmNFYA haplotypes in the presence of GmNFYA by transient expression in N. benthamiana leaves. The LUC reporter gene fused with GmNFYA was driven by each haplotype and the luminescence intensity was determined after water or 300 mM NaCl treatment overnight. (j) Quantitative analysis of luminescence intensity in (i). Bars indicate SD (n = 4). (k) ChIP analysis of H3K9ac levels at the promoter of GmLOS2, GmXTH23‐2 and GmOMT in soybean plants belonging to three kinds of haplotypes, such as NN (Hap 1), KF (Hap 2) and BD5 (Hap 3). Bars indicate SD (n = 3). (l) Working model of GmNFYA in response to salinity stress. Under normal condition, GmFVE may interact with GmHDA13 to inhibit stress‐responsive genes through histone deacetylation. Under salt stress, GmNFYA accumulated and competitively interacted with GmFVE to remove GmHDA13 function for maintenance of histone acetylation and activation of stress‐responsive genes for salt tolerance. For (c), (e), (g) and (j), asterisks indicate significant difference compared with the corresponding controls (*, P < 0.05; **, P < 0.01). For (h) and (k), the lowercase ‘a’ to ‘d’ indicate significant differences (P < 0.05 or P < 0.01).
