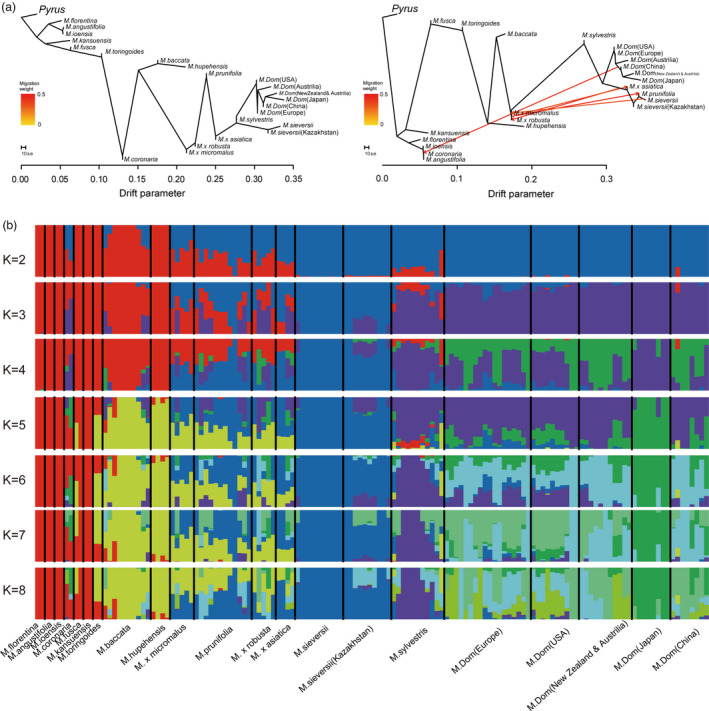
Figure 2.

Introgression and structure of Malus accessions. (a) Maximum‐likelihood (ML) tree of Malus species with inferred migration edges. Arrows on the graph represent admixture events between different Malus species. (b) Population structure of Malus species inferred using ADMIXTURE for an assumed number of groups (K) from 2 to 8.
