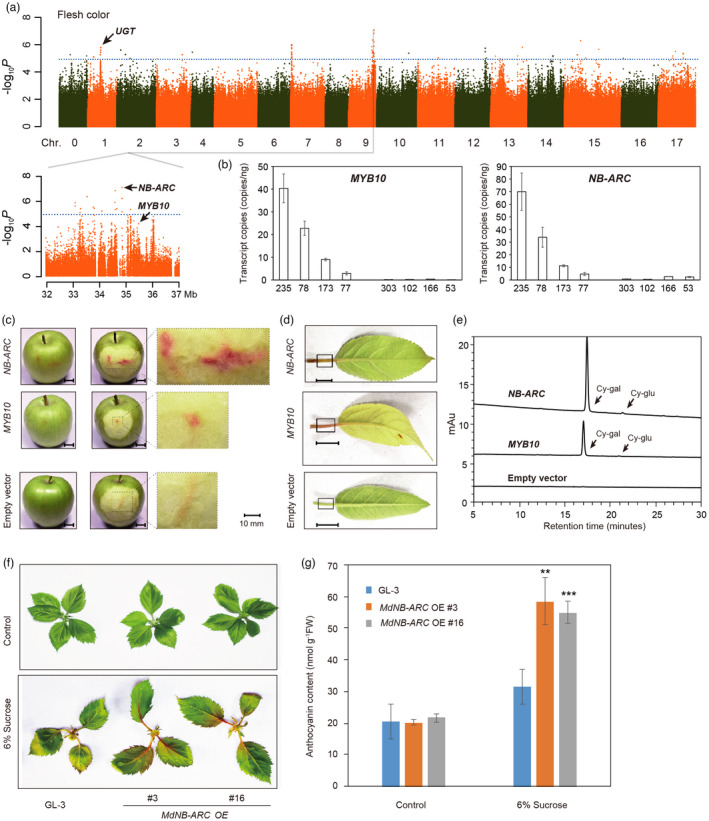
Figure 4.

Identification and functional analyses of genes identified through GWAS analysis of flesh colour. (a) Manhattan plot showing the results of GWAS analysis of flesh colour and genomic locations of significant SNPs located around representative genes for flesh colour. The dotted blue line represents the Bonferroni‐corrected significant threshold for GWAS (–log10 P = 5). (b) Absolute quantification of MdMYB10 and MdNB‐ARC (MD09G1272500) expression in red‐ and white‐ fleshed accessions. 235, 78, 77, 173 are red‐fleshed apple accessions; 303, 102, 166, 53 are white‐fleshed accessions. (c) and (d) Phenotypes of apple fruit flesh (c) and foliage (d) transiently expressing 35S:MdMYB10 or 35S:MdNB‐ARC. Bars = 10 mm. (e) Flesh anthocyanin accumulation determined by HPLC analysis. Fruits were transiently transformed with 35S:MdMYB10 or 35S:MdNB‐ARC. Peaks were identified from HPLC traces at 520 nm. (f) Phenotypes of MdNB‐ARC overexpression (OE) plants and GL‐3 (the wild type) under sucrose treatment. (g) Anthocyanin content of the plants shown in (f). Statistical analysis was performed using one‐way analysis of variance (ANOVA) followed by Student's t‐test. **P < 0.01, ***P < 0.001.
