Abstract
Background
The H/ACA small nucleolar ribonucleoprotein (snoRNP) gene family, including GAR1 ribonucleoprotein (GAR1), NHP2 ribonucleoprotein (NHP2), NOP10 ribonucleoprotein (NOP10), and dyskerin pseudouridine synthase 1 (DKC1), play important roles in ribosome biogenesis. However, the potential clinical value of the H/ACA snoRNP gene family in hepatocellular carcinoma (HCC) has not yet been reported.
Methods
Bioinformation databases were used to analyze the expression and roles of the H/ACA snoRNP gene family in HCC. Survival analysis, Gene Ontology (GO), and Kyoto Encyclopedia of Genes and Genomes enrichment pathway (KEGG) analyses were performed using R software. Tumor Immune Estimation Resource (TIMER) was used to analyze the correlation between the expression of the H/ACA snoRNP gene family and immune infiltration in HCC. Finally, immunohistochemistry and Western blotting were performed to verify the protein expression of the H/ACA snoRNP gene family in HCC tissues and adjacent tissues.
Results
The expression of the H/ACA snoRNP gene family was significantly increased in HCC samples compared to normal tissues, and the area under the curve (AUC) of GAR1, NHP2, NOP10, and DKC1 was 0.898, 0.962, 0.884, and 0.911, respectively. Increased expression of the H/ACA snoRNP gene family was associated with poor prognosis in HCC patients (Hazard Ratio, HR = 1.44 [1.02–2.04], 1.70 [1.20–2.40], 1.53 [1.09–2.17], and 1.43 [1.02–2.03], respectively; log-rank P = 0.036, 0.003, 0.014, 0.039, respectively). GO and KEGG analyses showed that co-expressed genes were primarily enriched in ribosome biogenesis. In addition, upregulated expression of H/ACA snoRNP gene family was related to the infiltration of various immune cells and multiple T cell exhaustion markers in HCC patients. Immunohistochemical analysis and Western blotting showed that the protein expression of H/ACA snoRNP gene family was higher in HCC tissues than in adjacent tissues of clinical samples.
Conclusion
H/ACA snoRNP gene family expression was higher in HCC tissues than in normal or adjacent tissues and was highly associated with poor prognosis of HCC patients and, therefore, has the potential to serve as diagnostic and prognostic biomarkers for HCC.
Keywords: hepatocellular carcinoma, H/ACA snoRNP gene family, diagnosis, prognosis, biomarker
Introduction
Primary liver cancer, including hepatocellular carcinoma (HCC) and intrahepatic cholangiocarcinoma, is the sixth most commonly diagnosed cancer and the fourth leading cause of cancer-related deaths worldwide.1 High metastasis and recurrence rates, as well as limited treatment options, lead to the poor prognosis of advanced HCC.2 Among patients diagnosed with early HCC, the 5-year survival rate after surgical intervention is > 93%.3 Currently, imaging technology combined with serum alpha-fetoprotein (AFP) detection is the most commonly used diagnostic modality, while pathological biopsy is still the gold standard for the diagnosis of HCC.4 However, there is still a lack of monitoring indicators in the early stages of HCC. Therefore, screening effective biomarkers is very important for the early diagnosis and management of HCC.
In addition to AFP, growing evidence has shown that many promising biomarkers, such as glypican-3 (GPC3),5 Golgi protein-73 (GP73),6 osteopontin (OPN),7 and nucleic acids such as circulating tumor DNA (ctDNA),8 DNA methylation,9 microRNA (miRNA),10 long noncoding RNA (lncRNA)11 and circular RNA (circRNA),12 may be clinically applied in the early diagnosis of HCC as a simple and non-invasive method to assess prognosis as well as aid in the development of new drugs and the selection of therapeutic strategies. However, because of many limitations and room for development, biomarkers for the diagnosis and prognosis of HCC still need to be thoroughly studied.
The H/ACA snoRNP (small nucleolar ribonucleoprotein) gene family, consisting of the ribonucleoproteins GAR1, NHP2, and NOP10, and the protein dyskerin pseudouridine synthase 1 (DKC1), play an important role in the formation of ribosomes.13 Ribosome biogenesis defects could confer a positive selective advantage on cancer cells, in combination with other simultaneous gene lesions, ultimately favoring uncontrolled growth.14 Evidence has suggested that ribosome biogenesis could serve as an effective target for cancer treatment, and several corresponding target compounds have entered clinical trials.15 In addition, GAR1, NHP2, NOP10, and DKC1 together form the telomerase complex,16 and telomerase activity is associated with the stemness and proliferation of cancer cells.17 Tang et al18 reported that knockdown of NHP2 could inhibit HBx-induced hepatocarcinogenesis by destroying the stability of the telomerase complex. Gong et al19 indicated that NHP2 is a core component of the telomerase complex associated with age, and high NHP2 expression predicted poor overall survival, with a more significant correlation in aged patients with colorectal cancer. Elsharawy et al20 reported that NOP10 was associated with poor prognostic characteristics and poor survival outcomes in breast cancer, helping to predict chemotherapy resistance. Cui et al21 suggested that loss of NOP10 may inhibit lung cancer cell growth, colony formation, migration, and invasion indicating that NOP10 has an oncogenic role in NSCLC. Zhang et al22 suggested that the expression of DKC1 in clear cell renal cell carcinoma (ccRCC) was markedly higher than that in adjacent tissues, and knockdown of DKC1 inhibited ccRCC progression through the NF-κB/MMP-2 signaling pathway. Another study by Elsharawy et al23 indicated that the overexpression of DKC1 contributes to the proliferation and progression of aggressive breast cancer. Hou et al24 pointed out that DKC1 enhanced angiogenesis by promoting HIF-1α transcription and facilitated metastasis in colorectal cancer. However, the value of the H/ACA snoRNP gene family in the diagnosis and prognosis of HCC has not been fully elucidated.
In the present study, online databases and R software were used for bioinformatics data mining and analysis to investigate the diagnostic and prognostic values of the H/ACA snoRNP gene family in HCC. Clinical samples were collected to further verify gene expression. These results suggest that the H/ACA snoRNP gene family could be used as diagnostic and prognostic biomarkers for HCC.
Methods
Clinical Tissues Samples
Twenty patients diagnosed with HCC at the First Affiliated Hospital of Chongqing Medical University were enrolled in this study. This study was approved by the ethics committee of the first Affiliated Hospital of Chongqing Medical University. All patients provided written informed consent before sampling. The tumor and adjacent tissues were immediately transferred to formalin after surgical resection. Subsequently, the samples were embedded in paraffin and stored.
Gene Expression and Receiver Operating Characteristic (ROC) Analysis
Gene expression data of liver hepatocellular carcinoma (LIHC) in level 3 HTSeq-FPKM (fragments per kilobase of transcript per million fragments mapped) RNAseq were downloaded from The Cancer Genome Atlas (TCGA) (https://tcga-data.nci.nih.gov/tcga/) for analysis. After log2 transformation of RNAseq data in FPKM format, gene expression comparisons between samples were performed, and ROC analyses of H/ACA snoRNP gene family were performed through the “pROC” package (version 1.17.0.1).
TNMplot
TNMplot (https://www.tnmplot.com) is an online analysis platform whose gene arrays form the NCBI-GEO and RNA-seq from TCGA, TARGET, and Genotype-Tissue Expression (GTEx) Project repositories.25 This platform enabled us to analyze the expression of the H/ACA snoRNP gene family in tumor and normal tissues.
UALCAN
UALCAN (http://ualcan.path.uab.edu) is an easy to use interactive web portal to perform in-depth analyses of TCGA gene expression data. This free online tool is primarily used to analyze gene expression across tumor and normal samples, explore the correlation between RNA expression and clinical characteristics.26
HCCDB
HCCDB (http://lifeome.net/database/hccdb), consisting of 15 datasets containing approximately 4000 clinical samples, serves as a one-stop online resource for exploring HCC gene expression. Users can perform differential expression, tissue-specific and tumor-specific expression, survival, and co-expression analysis using this online free tool with user-friendly interfaces.27
LinkedOmics
The LinkedOmics database (http://www.linkedomics.org/login.php) contains multi-omics data and clinical data for 32 cancer types and a total of 11,158 patients from TCGA.28 We used this online platform to analyze differentially expressed genes related to the H/ACA snoRNP gene family in the TCGA-LIHC cohort (n = 371), and Pearson’s correlation coefficient served as an evaluation index to analyze the correlation of genes.
GeneMANIA
GeneMANIA (https://genemania.org) can identify other genes related to input genes using a very large set of functional association data, including protein and genetic interactions, pathways, co-expression, co-localization, and protein domain similarity.29 Genes interacted to the H/ACA snoRNP gene family were analyzed using this online tool.
Gene Ontology (GO) and Kyoto Encyclopedia of Genes and Genome (KEGG) Analyses
After analyzing the differentially expressed genes related to the H/ACA snoRNP gene family in the TCGA-LIHC cohort (n = 371) using the LinkedOmics database, the co-expressed genes were screened using Pearson correlation coefficients (|r|>0.4, P<0.001). GO and KEGG analyses were performed using the R packages “ggplot2” (version 3.3.3) and “clusterProfiler” (version 3.15.3).30 GO analysis included biological process (BP), cell composition (CC), and molecular function (MF).
TIMER
TIMER (http://cistrome.shinyapps.io/timer) provides a user-friendly web interface for dynamic analysis and visualization of the associations between immune infiltrates and a wide spectrum of factors, including gene expression, clinical outcomes, somatic mutations, and somatic copy number alterations.31 Most immune cell types are negatively correlated with tumor purity, therefore tumor purity is a major confounding factor from TIMER database. In this study, we used this tool to analyze the correlation between gene expression and immune infiltrations in HCC.
Immunohistochemistry (IHC) Analysis
Paraffin embedded HCC tissue samples were used for this assay according to the manufacturer’s instructions. After incubation with primary antibody GAR1 (1:150, Sangon, China), NHP2 (1:150, Sangon, China), NOP10 (1:150, Cusabio, China), and DKC1 (1:100, Signalway, China), the sections were incubated with the corresponding secondary antibody for 30 min at 25 °C. The intensity of immunostaining was scored as 0 (no immunostaining), 1 (weak immunostaining), 2 (moderate immunostaining), or 3 (strong immunostaining).32 The percentage of positive cells was scored as 0 (<5%), 1 (5–25%), 2 (26–50%), 3 (51–75%), 4 (76–100%). Finally, the IHC score for each sample was calculated as the intensity of immunostaining score multiplied by the percentage of positive cells score.
Western Blotting
Western blotting was performed using standard methods. Protein concentration was measured using a BCA protein assay kit (Beyotime, China). Equal amounts of protein were separated by electrophoresis on 15% sodium dodecyl sulfate-polyacrylamide gel electrophoresis and transferred electrophoretically onto PVDF membranes (0.22 um, Whatman Westran PVDF membrane, GE Healthcare Life Science, Germany). The membranes were blocked for 30 min with 5% nonfat milk. After blocking, the membranes were incubated overnight with anti-GAR1 (1:500, Sangon, China), anti-NHP2 (1:500, Sangon, China), anti-NOP10 (1:500, Cusabio, China), anti-DKC1 (1:1000, Signalway, China), and β-actin (1:2000, ABclonal, China) at 4 °C. After washing with TBST, the membrane was incubated for 1 h at room temperature with horseradish peroxidase-conjugated anti-rabbit IgG or anti-mouse IgG (1:2000, Proteintech, USA) in TBST. Finally, signals were developed using an enhanced chemiluminescence system kit.
Statistical Analysis
SPSS version 22.0 (IBM, USA) was used for the analysis. The Cox proportional hazards model was used for the univariate and multivariate analyses. Clinical characteristics and the expression of the H/ACA snoRNP gene family were analyzed in the univariate Cox proportional regression analysis, and variables with P < 0.1 in the univariate analysis were included in the multivariate Cox proportional hazards model to adjusted for potential confounders. Prognostic analysis was performed using the “survival” package (version 3.2–10) by R Studio (version 3.6.3). Statistical significance was set at P<0.05.
Results
The Expression and Diagnostic Value of H/ACA snoRNP Gene Family in HCC
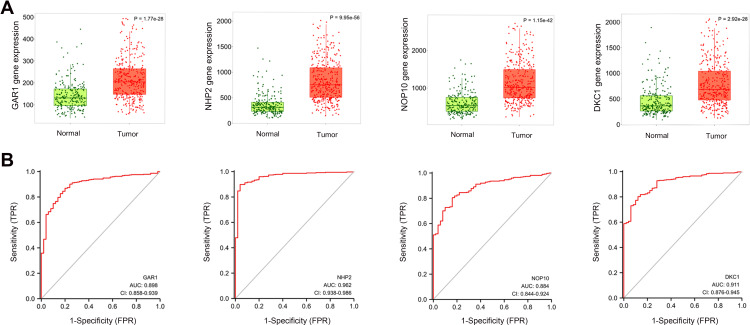
As shown in Figure 1, the expression of the H/ACA snoRNP gene family in tumor tissues was higher than that in normal tissues in the TNMplot databases (P = 1.77e-28, 9.95e-56, 1.15e-42, 2.92e-28, respectively). In addition, the data from TCGA showed that the mRNA levels of the H/ACA snoRNP gene family were also much higher in tumor tissues than in normal tissues (all P < 0.001) (Figure S1). Furthermore, the differential expression of the H/ACA snoRNP gene family in various tissues was visualized in HCCDB (Figure S2). Among the datasets, we found that the expression of GAR1 (10 of 11 datasets), NHP2 (10 of 11 datasets), NOP10 (7 of 11 datasets), and DKC1 (7 of 12 datasets) distinctly increased in HCC tissues compared with adjacent tissues. The overall expression of the H/ACA snoRNP gene family in different tissues was illustrated by chart bars (Figure S3). Regardless of whether compared with adjacent or all tissues, the expression levels of the H/ACA snoRNP gene family in HCC were much higher. ROC curve analysis revealed that the AUC were 0.898, 0.962, 0.884, and 0.911 for GAR1, NHP2, NOP10, and DKC1, respectively (Figure 1B). Importantly, the AUC values of these four genes were all greater than 0.85, indicating that they have great predictive value for the diagnosis of HCC.
Figure 1.
The mRNA expression and diagnostic value of H/ACA snoRNP gene family. (A) The expressions of H/ACA snoRNP gene family were higher in tumor tissues than that in normal tissues in TNMplot. (B) The area under the curve (AUC) of H/ACA snoRNP gene family in HCC patients.
The Prognostic Value of H/ACA snoRNP Gene Family for HCC
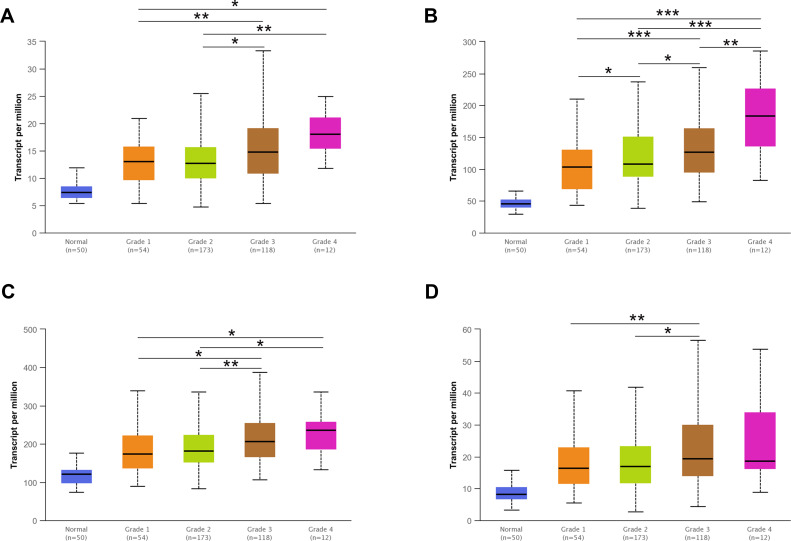
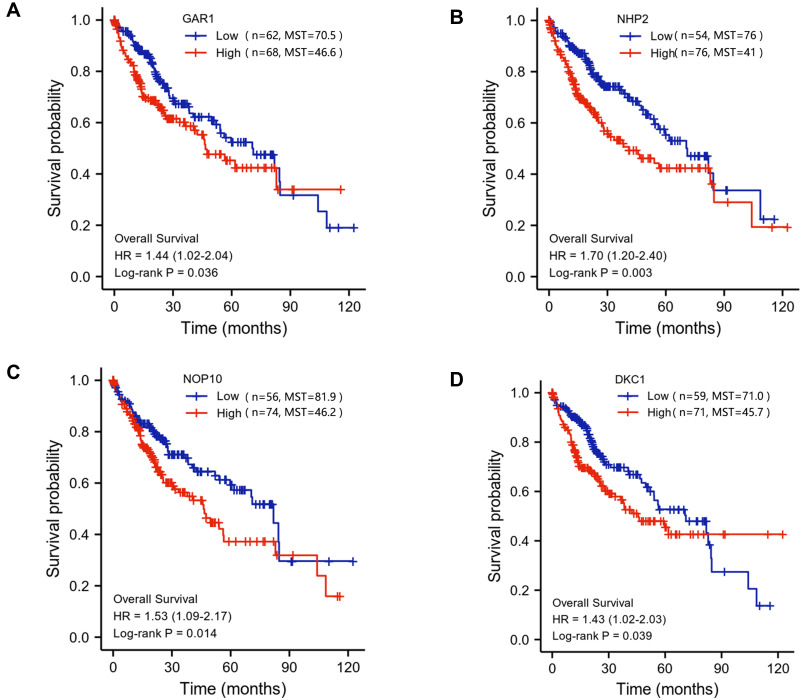
The above results showed that the H/ACA snoRNP gene family has great potential as a diagnostic marker for HCC. Then, UALCAN was used to display the different expression between the H/ACA snoRNP gene family and clinicopathological features. The results showed that GAR1, NHP2, and NOP10 were differentially expressed among varying tumor grades (P < 0.05) (Figure 2A–C), but the expression differences of DKC1 were found only in grade 1 vs grade 3 (P < 0.01) and grade 2 vs grade 3 (P < 0.05) (Figure 2D). There was a significant difference between the expression of NHP2 and gender (P < 0.001) (Figure S4A). The expression of the H/ACA snoRNP gene family was different among most individual cancer stages (P < 0.05) (Figure S4D). However, the expression of the H/ACA snoRNP gene family was not completely different in age and weight (Figure S4B and C). Spearman analysis of the H/ACA snoRNP gene family and clinical parameters were shown in Table 1. Gene expression data of LIHC in level 3 HTSeq-FPKM RNAseq were downloaded from TCGA for survival analysis with Log rank test, which contains 373 HCC samples. Survival analysis by R revealed that high expression of H/ACA snoRNP genes had negative effects on the prognosis of HCC (HR = 1.44 [1.02–2.04], 1.70 [1.20–2.40], 1.53 [1.09–2.17], and 1.43 [1.02–2.03], respectively; log-rank P = 0.036, 0.003, 0.014, 0.039, respectively; Figure 3A–D). The Cox proportional hazards model was used for univariate and multivariate analyses to reveal the gene expression associated with OS in HCC patients (Table 2). However, only the expression of GAR1, NHP2, and DKC1 was significantly associated with OS in univariate analysis (HR = 1.703 [1.208–2.403], 1.597 [1.209–2.109], and 1.774 [1.355–2.324], respectively, P = 0.002, <0.001, <0.001, respectively). The risk score of the H/ACA snoRNP gene family was included in the Cox regression analysis, and the results showed that the risk score was an independent prognostic risk factor for patients with HCC (HR = 1.582 [1.088–2.300], P = 0.016). Besides, the clinical characteristics, including age, tumor stage, and risk score, were selected to construct a prognostic nomogram to predict the probability of 1-, 3-, and 5‐year OS for HCC patients using the rms R package. The relationship between the predicted and observed risks for the outcomes of the nomogram was graphically displayed via calibration plots. The prognostic value of the H/ACA snoRNP gene family was shown by a nomogram and a risk score map (Figure S5A and B). The OS between high risk group and low risk group has significantly difference (HR = 0.65 [0.46–0.91], Log-rank P =0.012) (Figure S5C).
Figure 2.
The mRNA expression of H/ACA snoRNP gene family was different between tumor grades in the UALCAN database. (A) The mRNA expression of GAR1 was highly expressed in Grade 3 and Grade 4 patients than in Grade 1 and Grade 2. (B) The expression of NHP2 increased with the increase of tumor grades in HCC patients. (C) The mRNA expression of NOP10 was highly expressed in Grade 3 and Grade 4 patients than in Grade 1 and Grade 2. (D) The mRNA expression of DKC1 was different among Grade 1 to Grade 3. *P < 0.05, **P < 0.01, ***P < 0.001.
Table 1.
Spearman Analysis of H/ACA snoRNP Gene Family and Clinical Parameters
| Variables | GAR1 Expression Level | NHP2 Expression Level | NOP10 Expression Level | DKC1 Expression Level | ||||
|---|---|---|---|---|---|---|---|---|
| Spearman Correlation | P value | Spearman Correlation | P value | Spearman Correlation | P value | Spearman Correlation | P value | |
| Gender | −0.080 | 0.152 | −0.080 | 0.152 | 0.013 | 0.811 | −0.080 | 0.152 |
| Age | 0.078 | 0.163 | −0.016 | 0.770 | −0.071 | 0.205 | −0.036 | 0.520 |
| Weight | −0.052 | 0.351 | −0.128 | 0.022* | −0.126 | 0.023* | −0.080 | 0.153 |
| Tumor stage | 0.069 | 0.218 | 0.078 | 0.161 | 0.120 | 0.032* | 0.120 | 0.032* |
Note: *P < 0.05.
Figure 3.
The correlation between the mRNA expression of H/ACA snoRNP gene family and overall survival (OS) in HCC patients based on TCGA-LIHC database. (A) High mRNA expression of GAR1 was significantly correlated with poor OS (P = 0.036). (B) High mRNA expression of NHP2 was significantly correlated with poor OS (P = 0.003). (C) High mRNA expression of NOP10 was significantly correlated with poor OS (P = 0.014). (D) High mRNA expression of DKC1 was significantly correlated with poor OS (P = 0.039).
Abbreviation: MST, median survival time.
Table 2.
Univariate and Multivariate Cox Regression Analysis on Survival of HCC Patients in TCGA Dataset
| Characteristics | Total (N) | Univariate Analysis | Multivariate Analysis | ||
|---|---|---|---|---|---|
| Hazard Ratio (95% CI) | P value | Hazard Ratio (95% CI) | P value | ||
| Age | 368 | ||||
| < 60 | 169 | Reference | |||
| ≥ 60 | 199 | 0.991 (0.701–1.402) | 0.961 | ||
| Gender | 368 | ||||
| Female | 119 | Reference | |||
| Male | 249 | 0.800 (0.562–1.140) | 0.217 | ||
| AFP | 278 | 1.000 (1.000–1.000) | 0.430 | ||
| Stage | 344 | ||||
| Stage1 | 173 | Reference | |||
| Stage2 | 85 | 1.359 (0.836–2.208) | 0.216 | 1.165 (0.713–1.903) | 0.543 |
| Stage3 | 82 | 2.577 (1.694–3.922) | <0.001*** | 2.263 (1.479–3.464) | <0.001*** |
| Stage4 | 4 | 5.342 (1.651–17.289) | 0.005** | 6.156 (1.895–19.994) | 0.002** |
| Grade | 363 | ||||
| G1 | 55 | Reference | |||
| G2 | 176 | 1.157 (0.683–1.960) | 0.588 | ||
| G3 | 120 | 1.213 (0.701–2.101) | 0.490 | ||
| G4 | 12 | 1.690 (0.624–4.574) | 0.302 | ||
| GAR1 | 368 | 1.703 (1.208–2.403) | 0.002 | 1.288 (0.804–2.064) | 0.292 |
| NHP2 | 368 | 1.597 (1.209–2.109) | <0.001*** | 1.359 (0.968–1.907) | 0.077 |
| NOP10 | 368 | 1.269 (0.970–1.661) | 0.082 | 0.997 (0.697–1.427) | 0.988 |
| DKC1 | 368 | 1.774 (1.355–2.324) | <0.001*** | 1.341 (0.962–1.868) | 0.083 |
| Risk Score | 368 | ||||
| Low Risk | 186 | Reference | |||
| High Risk | 182 | 1.553 (1.099–2.195) | 0.013* | 1.582 (1.088–2.300) | 0.016* |
Notes: *P < 0.05, **P < 0.01, ***P < 0.001. Bold values are statistically significant.
Differentially Expressed Genes Correlated with H/ACA snoRNP Gene Family in HCC
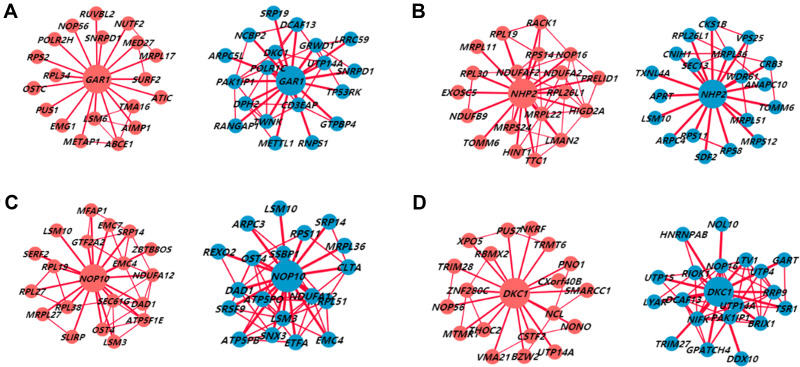
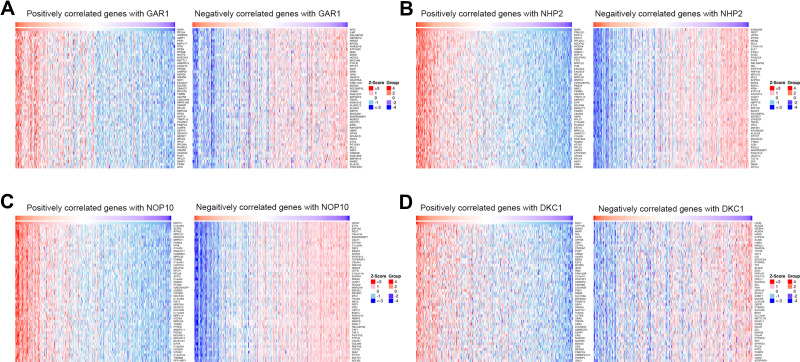
We analyzed the RNA sequences of 371 HCC patients from TCGA through LinkedOmics to reveal co-expressed genes associated with the H/ACA snoRNP gene family. The volcano plot illustrates the genes that were positively and negatively associated with the expression of the H/ACA snoRNP gene family (Figure S6). The differential co-expression networks differed significantly between HCC tissues and adjacent tissues in HCCDB (Figure 4). The heat maps show 50 co-expressed genes that were positively and negatively related to the H/ACA snoRNP gene family (Figure 5). Most of the differentially expressed genes of the H/ACA snoRNP gene family in HCCDB were consistent with the genes that were positively related to the H/ACA snoRNP gene family in the heat maps. The top 20 hub genes in the gene network interacted to the H/ACA snoRNP gene family are shown in Figure S7A. In addition, the mRNA expression of the 20 hub genes was increased in HCC tissues (Figure S7B, P <0.05).
Figure 4.
The co-expression networks of H/ACA snoRNP gene family in HCC tissues (red) and adjacent tissues (blue) from HCCDB. (A) Genes co-expressed with GAR1. (B) Genes co-expressed with NHP2. (C) Genes co-expressed with NOP10. (D) Genes co-expressed with DKC1.
Figure 5.
Heat maps of the top 50 genes positively and negatively correlated with H/ACA snoRNP gene family in HCC (LinkedOmics). (A) Genes associated with GAR1. (B) Genes associated with NHP2. (C) Genes associated with NOP10. (D) Genes associated with DKC1.
GO and KEGG Pathway Analyses
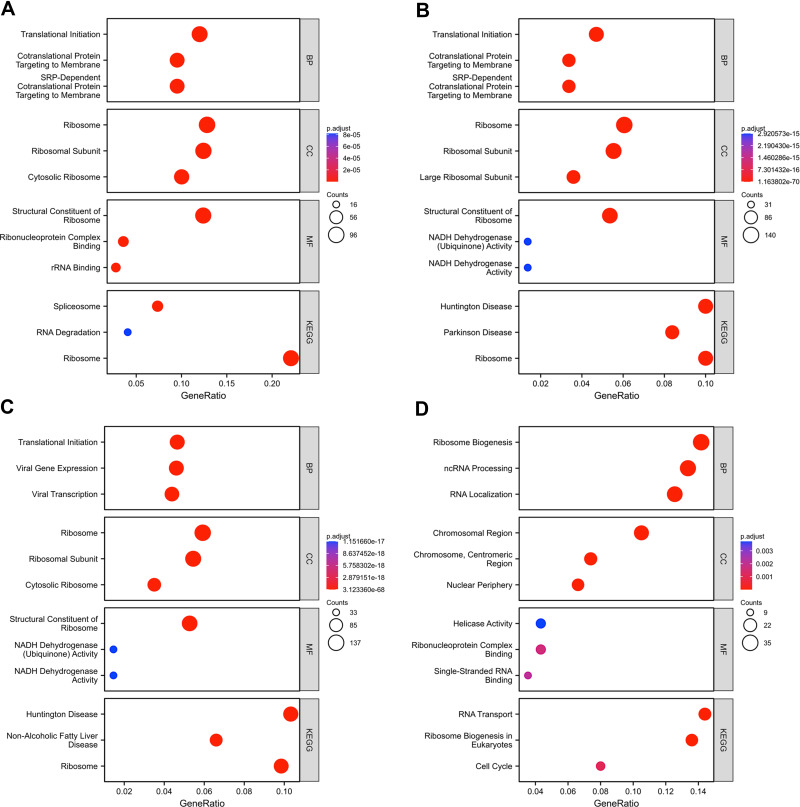
After screening the differentially expressed genes through LinkedOmics, the co-expressed genes of the H/ACA snoRNP gene family were screened using Pearson correlation coefficients (|r|>0.4, P<0.001). The R cluster Profiler package was used to conduct GO and KEGG analyses of these genes. GO analysis showed that significant differentially expressed genes in correlation with GAR1, NHP2, and NOP10 were involved in translational initiation, ribosome, ribosomal subunits, and structural constituents of ribosome (Figure 6A–C). However, differentially expressed genes correlated with DKC1 were primarily involved in ribosome biogenesis, chromosomal region, and helicase activity (Figure 6D). Furthermore, KEGG pathway analysis showed that these differentially expressed genes of GAR1, NHP2, and NOP10 were primarily enriched in ribosomes (Figure 6A–C), while DKC1 was primarily enriched in ribosome biogenesis in eukaryotes and RNA transport (Figure 6D), indicating that the H/ACA snoRNP gene family was related to ribosome biogenesis, the signaling pathway of which was shown in Figure S8.
Figure 6.
GO and KEGG analysis of genes co-expressed with H/ACA snoRNP gene family in HCC. (A) Enrichment analysis of genes co-expressed with GAR1. (B) Enrichment analysis of genes co-expressed with NHP2. (C) Enrichment analysis of genes co-expressed with NOP10. (D) Enrichment analysis of genes co-expressed with DKC1.
Correlation Between Gene Expression and Immune Infiltration in HCC
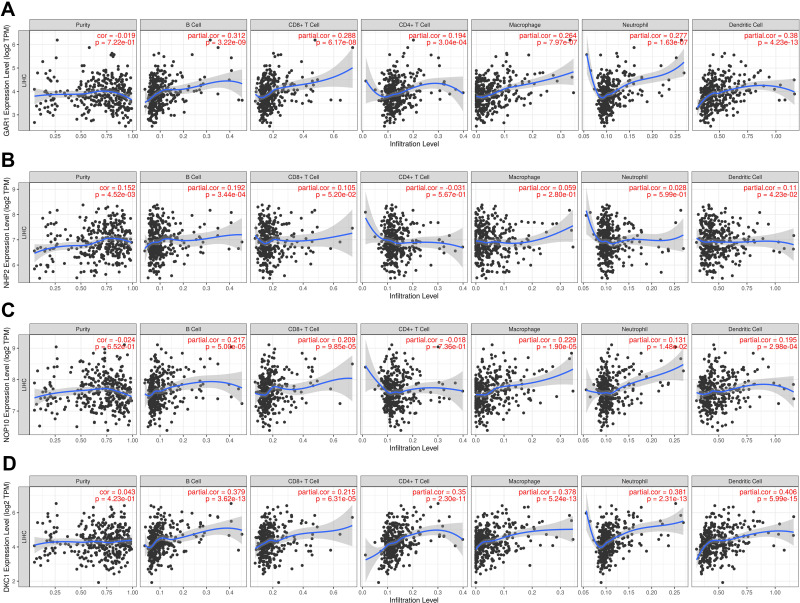
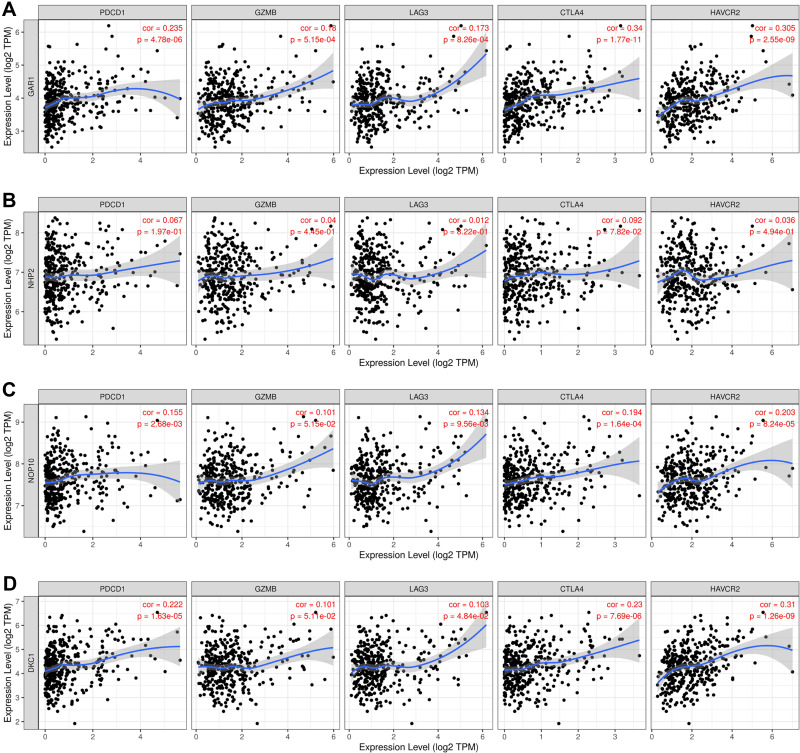
Evidence has shown that ribosome biogenesis may be involved in maintaining immune tolerance.33 Considering this, the correlations between the H/ACA snoRNP gene family and immune infiltration were determined by TIMER. The scatterplots were generated and displayed after inputs were submitted successfully, showing the purity-corrected partial Spearman’s rho value and statistical significance. The infiltration levels of B cells, CD8+ T cells, macrophages, neutrophils, and dendritic cells were positively correlated with the expression levels of GAR1 (partial correlation = 0.288, P = 6.17e-08; partial correlation = 0.264, P = 7.97e-07; partial correlation = 0.277, P = 1.63e-07; partial correlation = 0.38, P = 4.23e-13, Figure 7A), NOP10 (partial correlation = 0.217, P = 5.00e-05; partial correlation = 0.209, P = 9.85e-05; partial correlation = 0.229, P = 1.90e-05; partial correlation = 0.131, P = 1.48e-02, Figure 7C), and DKC1 (partial correlation = 0.379, P = 3.62e-13; partial correlation = 0.215, P = 6.31e-05; partial correlation = 0.378, P = 5.24e-13; partial correlation = 0.406, P = 5.99e-15, Figure 7D), but CD4+ T cell were only correlated with GAR1 and DKC1 (partial correlation = 0.194, P = 3.04e-04; partial correlation = 0.35, P = 2.30e-11, Figure 7A and D). Additionally, B cells and dendritic cells were correlated with the expression of NHP2 (partial correlation = 0.192, P = 3.44e-04; partial correlation = 0.11, P = 4.23e-02, Figure 7B). Furthermore, the TIMER database was also used to explore the correlation between the H/ACA snoRNP gene family and T cell exhaustion markers PD-1 (PDCD1), GZMB, LAG3, CTLA4, and HAVCR2 in HCC tissues. The results indicated a positive correlation between GAR1 expression and all T cell exhaustion markers in cancerous tissues (correlation = 0.235, 0.18, 0.173, 0.34, 0.305; P = 4.78e-06, 5.15e-04, 8.26e-04, 1.77e-11, respectively; Figure 8A). No significant differences were found between the expression of NHP2 and T cell exhaustion markers (Figure 8B). The expressions of NOP10 (correlation = 0.155, 0.134, 0.194,0.203; P = 2.68e-03, 9.56e-03, 1.64e-04, and 8.24e-05, respectively; Figure 8C) and DKC1 (correlation = 0.222, 0.103, 0.23, 0.31; P = 1.63e-05, 4.84e-02, 7.69e-06, 1.26e-09, respectively; Figure 8D) in HCC were positively correlated with PDCD1, LAG3, CTLA4, and HAVCR2 expression. Infiltrated CD8+ T cells and CD4+ T cell levels were both increased with increasing GAR1 and DKC1 expression levels, which was consistent with the expression of T cell exhaustion markers.
Figure 7.
The correlation between genes expression and immune infiltrations in HCC in the TIMER database. (A) The correlation between GAR1 expression and immune infiltrations. (B) The correlation between NHP2 expression and immune infiltrations. (C) The correlation between NOP10 expression and immune infiltrations. (D) The correlation between DKC1 expression and immune infiltrations.
Figure 8.
Correlation analysis between H/ACA snoRNP gene family expression and the expression of gene markers (PDCD1, GZMB, LAG3, CTLA4 and HAVCR2) related to T cell exhaustion (TIMER). (A) The correlation between GAR1 expression and T cell exhaustion markers. (B) The correlation between NHP2 expression and T cell exhaustion markers. (C) The correlation between NOP10 expression and T cell exhaustion markers. (D) The correlation between DKC1 expression and T cell exhaustion markers.
Expression of H/ACA snoRNP Gene Family in HCC Tumor Tissues and Adjacent Tissues from Clinical Samples
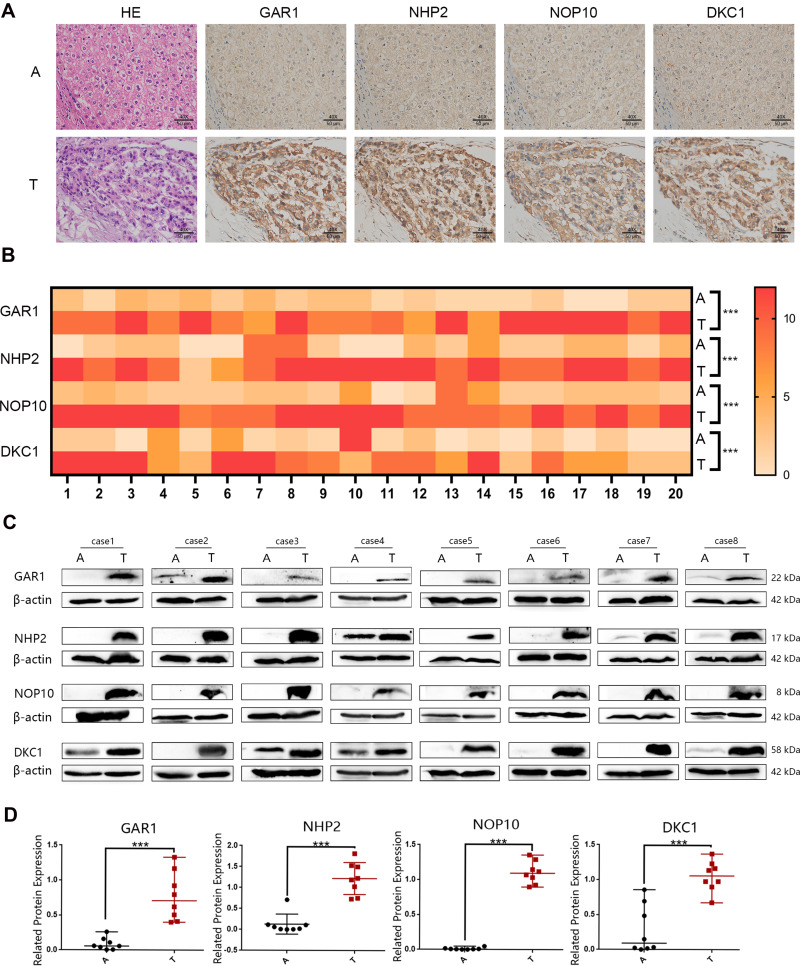
IHC analysis revealed that the H/ACA snoRNP gene family was differentially expressed in tumor tissues (T) and adjacent tissues (A). The protein expression of GAR1, NHP2, NOP10, and DKC1 were higher in HCC tissues than that in adjacent tissues (Figure 9A). As shown in Figure 9B, the heat map of IHC results demonstrated that HCC tissues were judged to be of high H/ACA snoRNP gene family expression compared with adjacent tissues (P < 0.001).
Figure 9.
The protein expression of H/ACA snoRNP gene family from HCC patients. (A) The expression of H/ACA snoRNP gene family in HCC tumor tissues and adjacent tissues tested by immunohistochemistry (magnification: 40×). (B) The heatmap of protein expression of H/ACA snoRNPs gene family with IHC score. (C) The expression of H/ACA snoRNP gene family in HCC tumor tissues and adjacent tissues tested by Western blotting. (D) Statistical differences of the protein relative expression levels for Western blotting bands. A: adjacent tissues. T: HCC tumor tissues. ***P < 0.001.
Western blotting was performed to validate the differentia expression of the H/ACA snoRNP gene family between adjacent tissues (A) and tumor tissues (T) in eight pairs of paired samples, and the results (Figure 9C and D) showed that the H/ACA snoRNP gene family had a higher expression in tumor tissues than that in adjacent tissues (P < 0.001), which was consistent with our bioinformatics analysis and IHC results.
Discussion
In this study, our results showed that the mRNA and protein levels of the H/ACA snoRNP gene family in HCC tissues were significantly higher than those in adjacent or normal tissues. Moreover, the H/ACA snoRNP gene family may serve as a risk factor in the prognosis of HCC patients and guide clinical treatment. We also performed bioinformatics analysis of the H/ACA snoRNP gene family and their co-expressed genes in order to reveal the underlying biological mechanisms involved in ribosome biogenesis and immune infiltration.
The H/ACA snoRNP gene family, including GAR1, NHP2, NOP10, and DKC1, play important roles in ribosome biogenesis, which has recently been considered a potential effective target in cancer treatment.14 A study34 of Hepatology showed that RACK1 O-GlcNAcylation is correlated with HCC development and recurrence in patients through regulating ribosome attachment, indicating that ribosome biogenesis may affect the progress of HCC. Another report35 suggested that SNORA18L5 increases ribosome biogenesis, facilitates ribosomal RNA maturation, and alters localization of RPL5 and RPL11, allowing for increased MDM2-mediated proteolysis of p53 and cell cycle arrest in HBV-related HCC. Hence, ribosome biogenesis may be involved in HCC, and H/ACA snoRNP gene family could be potential biomarkers. In this study, the results from different databases showed that the mRNA expression of the H/ACA snoRNP gene family was increased in HCC tissues compared with that in adjacent or normal liver tissues. Furthermore, IHC and Western blotting analyses of clinical HCC samples also confirmed this conclusion, which is consistent with previous studies.20–22,24,36 Cui et al21 found that high level of NOP10 expression was associated with poor prognosis in non-small cell lung cancer (NSCLC), and loss of NOP10 could inhibit the progression of NSCLC, while Elsharawy et al20 found that NOP10 high expression is a poor prognostic biomarker in breast cancer.
Next, our results indicated that these four genes showed great potential in the diagnosis of HCC, and the expression of the H/ACA snoRNP gene family was related to the poor prognosis of HCC. DKC1, the most studied family member, has been reported to regulate colorectal cancer angiogenesis and metastasis by directly binding to the promoter region of HIF-1α to enhance HIF-1α transcription.24 Zhang et al22 also found that knockdown of DKC1 inhibited proliferation, migration, and invasion of clear cell renal cell carcinoma by regulating the NF‑κB/MMP‑2 signaling pathway. Kan et al36 reported that knockdown of DKC1 induced G1 arrest and inhibited cell proliferation in lung adenocarcinoma, and DKC1 downregulation could induce telomere-related cell senescence and apoptosis. A previous study showed that DKC1 was upregulated through oxidative modification of PDIA3, leading to the survival of HCC cells.37 Furthermore, we analyzed the correlation between the expression of the H/ACA snoRNP gene family and clinicopathological characteristics. We used public data for univariate and multivariate analyses, but the results were not statistically significant because of insufficient samples, incomplete information of samples, and different analysis methods.
In addition, the co-expression networks of the H/ACA snoRNP gene family in the tumor and adjacent tissues were analyzed. GO and KEGG analysis showed that GAR1, NHP2, and NOP10 co-expressed genes were enriched in translational initiation and ribosomes, while DKC1 co-expressed genes were enriched in ribosome biogenesis, chromosomal regions, and RNA transport. GO and KEGG analyses suggested that the H/ACA snoRNP gene family may promote HCC progression by affecting the biological process of the ribosome. Under non-stress conditions, cap-dependent transcription is one of the main initiation mechanisms of mRNA translation in eukaryotic cells.38 When cap-dependent initiation is inhibited by various stresses, such as nutritional stress, hypoxia, proteotoxic stress, or genotoxic stress, these stressed cells, including cancer cells, are forced to rely on alternate translation modes, such as IRES-dependent, m6A-dependent, or re-initiation-dependent translation, to promote their survival and proliferation.39 In addition, increased ribosome synthesis in cancer cells can cope with an increase in protein synthesis and maintain unrestricted growth.15 Turi et al40 reported that the damage of ribosome biogenesis from rRNA synthesis to ribosome assembly could lead to serious consequences, such as cell cycle arrest, senescence, or apoptosis, through the RPL5/RPL11/5S rRNA/Mdm2/p53 axis. Therefore, targeting various steps of ribosome biogenesis seems to be an effective treatment for tumors.
Immune cells constitute an important part of tumor tissue and have clinicopathological significance in predicting prognosis and therapeutic efficacy. The immune high subtype (increased B-/plasma-cell and T cell infiltration) and B-cell infiltration have been identified as independent positive prognostic factors.41 Immune cell subsets are an important part of the HCC tumor microenvironment (TME), and the magnitude of immune suppression in the tumor microenvironment is closely correlated with poor prognosis in HCC patients.42 Zhu et al33 found that the ribosome biogenesis factor, Noc4L, could control the activation of Tregs and maintain immune tolerance. Our results showed that the H/ACA snoRNP gene family may also play important roles in ribosome biogenesis. Therefore, we investigated the correlation between the H/ACA snoRNP gene family and immune infiltration. Our study found that the expression of GAR1, NOP10, and DKC1 was positively correlated with the infiltration of a variety of immune cells. It has been reported that exhaustion of infiltrating T cells has been observed in HCC and is associated with poor prognosis.43 Similarly, in our study, the expression of GAR1, NOP10, and DKC1 was positively correlated with multiple T cell exhaustion markers in HCC. Hence, we speculated that the upregulation of GAR1, NOP10, and DKC1 may lead to the dysregulation of T cells to promote tumor progression. Interestingly, the expression of NHP2 did not show a significant correlation with immune cell infiltration and T cell exhaustion markers. Therefore, it was speculated that NHP2 may regulate the occurrence and development of HCC through other pathways.
Conclusion
In conclusion, the H/ACA snoRNP gene family showed great potential for the diagnosis and prognosis of HCC. This gene family may promote HCC progression by influencing the biological processes of ribosomes. In addition, upregulation of GAR1, NOP10, and DKC1 may lead to the dysregulation of T cells and promote tumor progression. Further development of accurate and rapid methods to identify the molecular function mechanism of the H/ACA snoRNP gene family is still needed.
Acknowledgments
We would like to thank the TNMplot, UALCAN, HCCDB, LinkedOmics, GeneMANIA, TIMER, TCGA databases, for the availability of the data. In addition, we would like to thank Xinyu Xiao and Yu Gao for their excellent technical assistance. Last but not least, Mi Zhang wants to thank his girlfriend, Linlin Huo, for her support, affection and understanding, and ask her “would you like to be with me forever?”.
Funding Statement
This study was supported by Key Project of Chongqing Natural Science Foundation (cstc2017jcyjB0283), National Science Foundation of China (No. 97081252), and Science and Technology Research Foundation of Chongqing Municipal Education Commission (No. KJQN201900425).
Ethical Approval
This was approved by the institutional review board “Ethics Committee of Chongqing Medical University”, and in accordance with the 1964 Helsinki declaration.
Author Contributions
All authors made a significant contribution to the work reported, whether that is in the conception, study design, execution, acquisition of data, analysis and interpretation, or in all these areas; took part in drafting, revising or critically reviewing the article; gave final approval of the version to be published; have agreed on the journal to which the article has been submitted; and agree to be accountable for all aspects of the work.
Disclosure
The authors have no conflicts of interest.
References
- 1.Bray F, Ferlay J, Soerjomataram I, Siegel RL, Torre LA, Jemal A. Global cancer statistics 2018: GLOBOCAN estimates of incidence and mortality worldwide for 36 cancers in 185 countries. CA Cancer J Clin. 2018;68(6):394–424. doi: 10.3322/caac.21492 [DOI] [PubMed] [Google Scholar]
- 2.Llovet JM, Zucman-Rossi J, Pikarsky E, et al. Hepatocellular carcinoma. Nat Rev Dis Primers. 2016;2:16018. doi: 10.1038/nrdp.2016.18 [DOI] [PubMed] [Google Scholar]
- 3.Takayama T, Makuuchi M, Kojiro M, et al. Early hepatocellular carcinoma: pathology, imaging, and therapy. Ann Surg Oncol. 2008;15(4):972–978. doi: 10.1245/s10434-007-9685-0 [DOI] [PubMed] [Google Scholar]
- 4.Tsuchiya N, Sawada Y, Endo I, Saito K, Uemura Y, Nakatsura T. Biomarkers for the early diagnosis of hepatocellular carcinoma. World J Gastroenterol. 2015;21(37):10573–10583. doi: 10.3748/wjg.v21.i37.10573 [DOI] [PMC free article] [PubMed] [Google Scholar]
- 5.Di Tommaso L, Destro A, Seok JY, et al. The application of markers (HSP70 GPC3 and GS) in liver biopsies is useful for detection of hepatocellular carcinoma. J Hepatol. 2009;50(4):746–754. doi: 10.1016/j.jhep.2008.11.014 [DOI] [PubMed] [Google Scholar]
- 6.Mao Y, Yang H, Xu H, et al. Golgi protein 73 (GOLPH2) is a valuable serum marker for hepatocellular carcinoma. Gut. 2010;59(12):1687–1693. doi: 10.1136/gut.2010.214916 [DOI] [PubMed] [Google Scholar]
- 7.Shang S, Plymoth A, Ge S, et al. Identification of osteopontin as a novel marker for early hepatocellular carcinoma. Hepatology. 2012;55(2):483–490. doi: 10.1002/hep.24703 [DOI] [PMC free article] [PubMed] [Google Scholar]
- 8.Xu RH, Wei W, Krawczyk M, et al. Circulating tumour DNA methylation markers for diagnosis and prognosis of hepatocellular carcinoma. Nat Mater. 2017;16(11):1155–1161. doi: 10.1038/nmat4997 [DOI] [PubMed] [Google Scholar]
- 9.Cheng J, Wei D, Ji Y, et al. Integrative analysis of DNA methylation and gene expression reveals hepatocellular carcinoma-specific diagnostic biomarkers. Genome Med. 2018;10(1):42. doi: 10.1186/s13073-018-0548-z [DOI] [PMC free article] [PubMed] [Google Scholar]
- 10.Yang N, Ekanem NR, Sakyi CA, Ray SD. Hepatocellular carcinoma and microRNA: new perspectives on therapeutics and diagnostics. Adv Drug Deliv Rev. 2015;81:62–74. doi: 10.1016/j.addr.2014.10.029 [DOI] [PubMed] [Google Scholar]
- 11.Huang Z, Zhou JK, Peng Y, He W, Huang C. The role of long noncoding RNAs in hepatocellular carcinoma. Mol Cancer. 2020;19(1):77. doi: 10.1186/s12943-020-01188-4 [DOI] [PMC free article] [PubMed] [Google Scholar]
- 12.Hu J, Li P, Song Y, et al. Progress and prospects of circular RNAs in Hepatocellular carcinoma: novel insights into their function. J Cell Physiol. 2018;233(6):4408–4422. doi: 10.1002/jcp.26154 [DOI] [PubMed] [Google Scholar]
- 13.Kiss T, Fayet E, Jády BE, Richard P, Weber M. Biogenesis and intranuclear trafficking of human box C/D and H/ACA RNPs. Cold Spring Harb Symp Quant Biol. 2006;71:407–417. doi: 10.1101/sqb.2006.71.025 [DOI] [PubMed] [Google Scholar]
- 14.Bustelo XR, Dosil M. Ribosome biogenesis and cancer: basic and translational challenges. Curr Opin Genet Dev. 2018;48:22–29. doi: 10.1016/j.gde.2017.10.003 [DOI] [PubMed] [Google Scholar]
- 15.Catez F, Dalla Venezia N, Marcel V, Zorbas C, Lafontaine DLJ, Diaz JJ. Ribosome biogenesis: an emerging druggable pathway for cancer therapeutics. Biochem Pharmacol. 2019;159:74–81. doi: 10.1016/j.bcp.2018.11.014 [DOI] [PubMed] [Google Scholar]
- 16.Fu D, Collins K. Purification of human telomerase complexes identifies factors involved in telomerase biogenesis and telomere length regulation. Mol Cell. 2007;28(5):773–785. doi: 10.1016/j.molcel.2007.09.023 [DOI] [PMC free article] [PubMed] [Google Scholar]
- 17.Noureen N, Wu S, Lv Y, et al. Integrated analysis of telomerase enzymatic activity unravels an association with cancer stemness and proliferation. Nat Commun. 2021;12(1):139. doi: 10.1038/s41467-020-20474-9 [DOI] [PMC free article] [PubMed] [Google Scholar]
- 18.Tang S, Wu W, Wan H, Wu X, Chen H. Knockdown of NHP2 inhibits hepatitis B virus X protein-induced hepatocarcinogenesis via repressing TERT expression and disrupting the stability of telomerase complex. Aging (Albany NY). 2020;12(19):19365–19374. doi: 10.18632/aging.103810 [DOI] [PMC free article] [PubMed] [Google Scholar]
- 19.Gong Y, Liu Y, Wang T, et al. Age-associated proteomic signatures and potential clinically actionable targets of colorectal cancer. Mol Cell Proteomics. 2021;20:100115. doi: 10.1016/j.mcpro.2021.100115 [DOI] [PMC free article] [PubMed] [Google Scholar]
- 20.Elsharawy KA, Althobiti M, Mohammed OJ, et al. Nucleolar protein 10 (NOP10) predicts poor prognosis in invasive breast cancer. Breast Cancer Res Treat. 2021;185(3):615–627. doi: 10.1007/s10549-020-05999-3 [DOI] [PMC free article] [PubMed] [Google Scholar]
- 21.Cui C, Liu Y, Gerloff D, et al. NOP10 predicts lung cancer prognosis and its associated small nucleolar RNAs drive proliferation and migration. Oncogene. 2021;40(5):909–921. doi: 10.1038/s41388-020-01570-y [DOI] [PMC free article] [PubMed] [Google Scholar]
- 22.Zhang M, Pan Y, Jiang R, et al. DKC1 serves as a potential prognostic biomarker for human clear cell renal cell carcinoma and promotes its proliferation, migration and invasion via the NF‑κB pathway. Oncol Rep. 2018;40(2):968–978. doi: 10.3892/or.2018.6484 [DOI] [PubMed] [Google Scholar]
- 23.Elsharawy KA, Mohammed OJ, Aleskandarany MA, et al. The nucleolar-related protein Dyskerin pseudouridine synthase 1 (DKC1) predicts poor prognosis in breast cancer. Br J Cancer. 2020;123(10):1543–1552. doi: 10.1038/s41416-020-01045-7 [DOI] [PMC free article] [PubMed] [Google Scholar]
- 24.Hou P, Shi P, Jiang T, et al. DKC1 enhances angiogenesis by promoting HIF-1α transcription and facilitates metastasis in colorectal cancer. Br J Cancer. 2020;122(5):668–679. doi: 10.1038/s41416-019-0695-z [DOI] [PMC free article] [PubMed] [Google Scholar]
- 25.Bartha Á, Győrffy B. TNMplot.com: a web tool for the comparison of gene expression in normal, tumor and metastatic tissues. Int J Mol Sci. 2021;22(5):2622. doi: 10.3390/ijms22052622 [DOI] [PMC free article] [PubMed] [Google Scholar]
- 26.Chandrashekar DS, Bashel B, Balasubramanya SAH, et al. UALCAN: a Portal for facilitating tumor subgroup gene expression and survival analyses. Neoplasia. 2017;19(8):649–658. doi: 10.1016/j.neo.2017.05.002 [DOI] [PMC free article] [PubMed] [Google Scholar]
- 27.Lian Q, Wang S, Zhang G, et al. HCCDB: a database of hepatocellular carcinoma expression atlas. Genom Proteomics Bioinform. 2018;16(4):269–275. doi: 10.1016/j.gpb.2018.07.003 [DOI] [PMC free article] [PubMed] [Google Scholar]
- 28.Vasaikar SV, Straub P, Wang J, Zhang B. LinkedOmics: analyzing multi-omics data within and across 32 cancer types. Nucleic Acids Res. 2018;46(D1):D956–d963. doi: 10.1093/nar/gkx1090 [DOI] [PMC free article] [PubMed] [Google Scholar]
- 29.Warde-Farley D, Donaldson SL, Comes O, et al. The geneMANIA prediction server: biological network integration for gene prioritization and predicting gene function. Nucleic Acids Res. 2010;38(Web Server issue):W214–220. doi: 10.1093/nar/gkq537 [DOI] [PMC free article] [PubMed] [Google Scholar]
- 30.Yu G, Wang LG, Han Y, He QY. clusterProfiler: an R package for comparing biological themes among gene clusters. Omics. 2012;16(5):284–287. doi: 10.1089/omi.2011.0118 [DOI] [PMC free article] [PubMed] [Google Scholar]
- 31.Li T, Fan J, Wang B, et al. TIMER: a web server for comprehensive analysis of tumor-infiltrating immune cells. Cancer Res. 2017;77(21):e108–e110. doi: 10.1158/0008-5472.CAN-17-0307 [DOI] [PMC free article] [PubMed] [Google Scholar]
- 32.Meyerholz DK, Beck AP. Principles and approaches for reproducible scoring of tissue stains in research. Lab Invest. 2018;98(7):844–855. doi: 10.1038/s41374-018-0057-0 [DOI] [PubMed] [Google Scholar]
- 33.Zhu X, Zhang W, Guo J, et al. Noc4L-mediated ribosome biogenesis controls activation of regulatory and conventional T cells. Cell Rep. 2019;27(4):1205–1220.e1204. doi: 10.1016/j.celrep.2019.03.083 [DOI] [PubMed] [Google Scholar]
- 34.Duan F, Wu H, Jia D, et al. O-GlcNAcylation of RACK1 promotes hepatocellular carcinogenesis. J Hepatol. 2018;68(6):1191–1202. doi: 10.1016/j.jhep.2018.02.003 [DOI] [PubMed] [Google Scholar]
- 35.Cao P, Yang A, Wang R, et al. Germline duplication of SNORA18L5 increases risk for HBV-related hepatocellular carcinoma by altering localization of ribosomal proteins and decreasing levels of p53. Gastroenterology. 2018;155(2):542–556. doi: 10.1053/j.gastro.2018.04.020 [DOI] [PubMed] [Google Scholar]
- 36.Kan G, Wang Z, Sheng C, Yao C, Mao Y, Chen S. Inhibition of DKC1 induces telomere-related senescence and apoptosis in lung adenocarcinoma. J Transl Med. 2021;19(1):161. doi: 10.1186/s12967-021-02827-0 [DOI] [PMC free article] [PubMed] [Google Scholar]
- 37.Ko E, Kim JS, Ju S, et al. Oxidatively modified protein-disulfide isomerase-associated 3 promotes dyskerin pseudouridine synthase 1-mediated malignancy and survival of hepatocellular carcinoma cells. Hepatology. 2018;68(5):1851–1864. doi: 10.1002/hep.30039 [DOI] [PubMed] [Google Scholar]
- 38.Sonenberg N, Hinnebusch AG. Regulation of translation initiation in eukaryotes: mechanisms and biological targets. Cell. 2009;136(4):731–745. doi: 10.1016/j.cell.2009.01.042 [DOI] [PMC free article] [PubMed] [Google Scholar]
- 39.Sriram A, Bohlen J, Teleman AA. Translation acrobatics: how cancer cells exploit alternate modes of translational initiation. EMBO Rep. 2018;19(10). doi: 10.15252/embr.201845947 [DOI] [PMC free article] [PubMed] [Google Scholar]
- 40.Turi Z, Lacey M, Mistrik M, Moudry P. Impaired ribosome biogenesis: mechanisms and relevance to cancer and aging. Aging (Albany NY). 2019;11(8):2512–2540. doi: 10.18632/aging.101922 [DOI] [PMC free article] [PubMed] [Google Scholar]
- 41.Kurebayashi Y, Ojima H, Tsujikawa H, et al. Landscape of immune microenvironment in hepatocellular carcinoma and its additional impact on histological and molecular classification. Hepatology. 2018;68(3):1025–1041. doi: 10.1002/hep.29904 [DOI] [PubMed] [Google Scholar]
- 42.Fu Y, Liu S, Zeng S, Shen H. From bench to bed: the tumor immune microenvironment and current immunotherapeutic strategies for hepatocellular carcinoma. J Exp Clin Cancer Res. 2019;38(1):396. doi: 10.1186/s13046-019-1396-4 [DOI] [PMC free article] [PubMed] [Google Scholar]
- 43.Kim HD, Song GW, Park S, et al. Association between expression level of PD1 by tumor-infiltrating CD8(+) T cells and features of hepatocellular carcinoma. Gastroenterology. 2018;155(6):1936–1950.e1917. doi: 10.1053/j.gastro.2018.08.030 [DOI] [PubMed] [Google Scholar]


