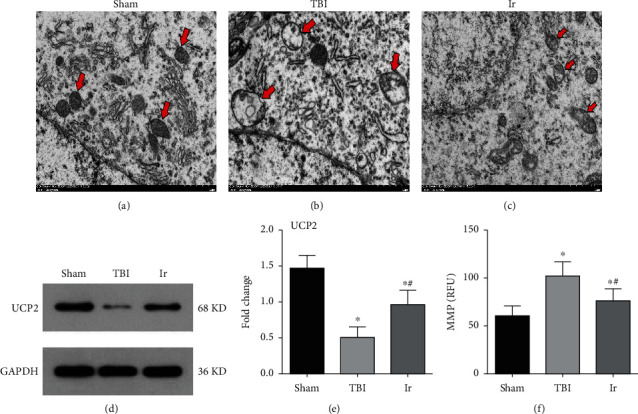
Figure 9.

The expressions of UCP2 and ultrastructure of mice at 24 hours after TBI. (a–c) Electron microscopic examination of neuronal mitochondria in mice at 24 hours after TBI. Arrows in red indicate mitochondrial structures of neurons. (d, e) Western blotting analysis of UCP2 in brain tissue at 24 hours after TBI. (f) Assessment of neuronal MMP in mice at 24 hours after TBI. Data are expressed as the mean ± SEM. Scale bars: 1.0 μm. n = 6. Significance was determined by one-way ANOVA and Dunnett's post hoc analysis. ∗P < 0.05 versus Sham group; #P < 0.05 versus TBI group.
