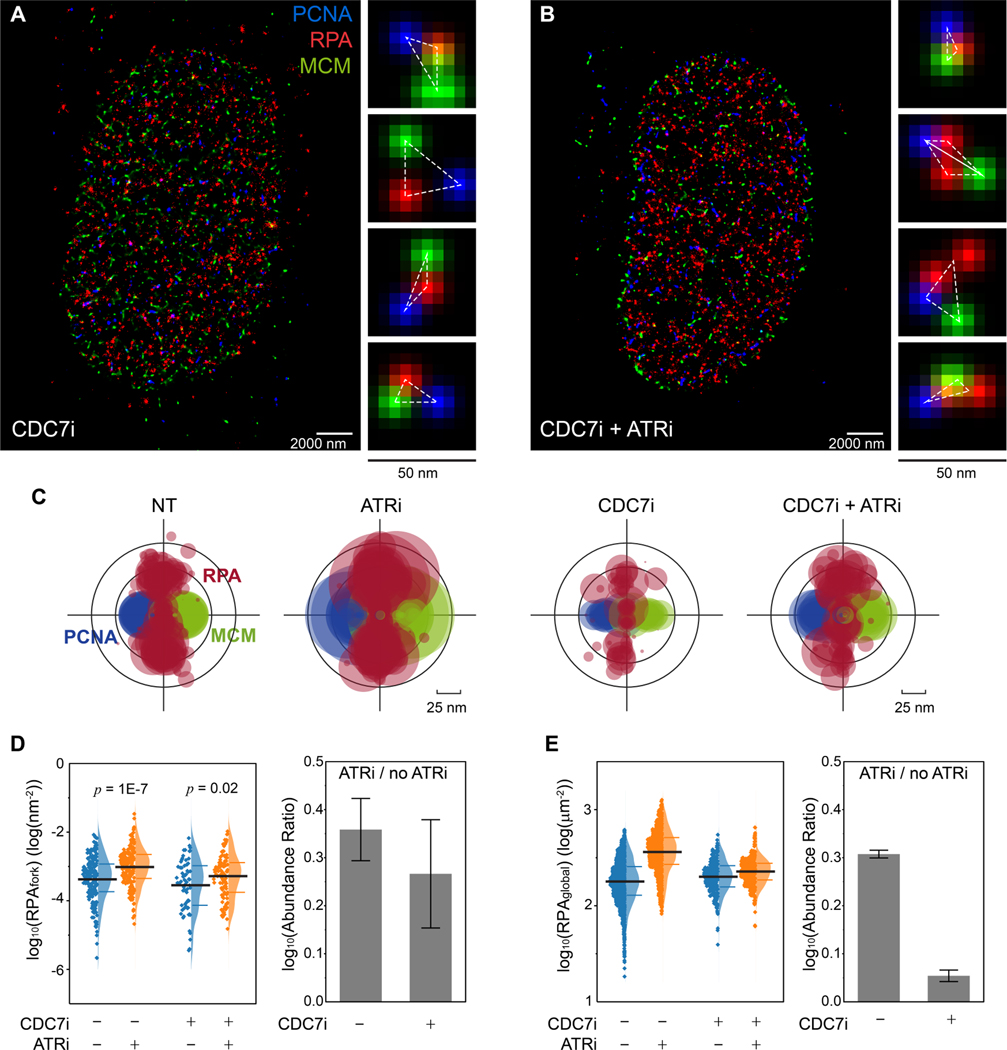
Figure 2. ATR prevents RPA accumulation at replication forks independent of ATR activity in limiting origin firing.
(A and B) Representative SMLM images of replication fork factors PCNA, RPA, and MCM in S phase cells that were treated with CDC7i (A) and CDC7i+ATRi (B). Magnified panels for each image show representative triplet patterns of individual replisomes.
(C) Overlaid PCNA-RPA-MCM TCF-resolved single-replisome configurations from SMLM images of single cells under different treatments. Circle size represents the average density of RPA at each fork within a nucleus.
(D) Quantification of the levels of RPAfork for the TCF-resolved single replisome configurations shown in (C) reveals that ATRi induces RPA accumulation even when excessive origin firing is suppressed via CDC7i. Mean values and the 1st and 3rd quartile were marked as black and colored bars, respectively, N = 193, 177, 67, and 97 for CDC7i-ATRi-, CDC7i-ATRi+, CDC7i+ATRi-, and CDC7i+ATRi+, respectively. Right panel: quantification of the abundance ratio between data with ATRi treatment and w/o ATRi treatment (ATRi / no ATRi). Error bar in log (Abundance Ratio) is the propagated SEM.
(E) Quantifications of the levels of RPAglobal within each single cell at different ATRi and CDC7i treatment conditions, indicating that inhibition of CDC7i suppresses the ATRi-induced origin firing. Mean values and the 1st and 3rd quartile were marked as black and colored bars, respectively, N = 1863, 1267, 277, and 483 for CDC7i-ATRi-, CDC7i-ATRi+, CDC7i+ATRi-, and CDC7i+ATRi+, respectively. Right panel: quantification of the abundance ratio between data with ATRi treatment and w/o ATRi treatment (ATRi / no ATRi). Error bars in log (Abundance Ratio) is the propagated SEM.

