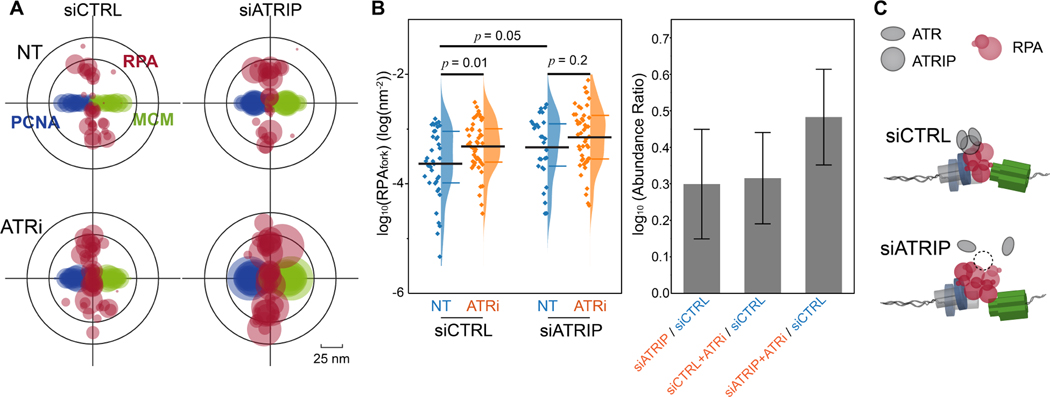
Figure 3. ATRIP is necessary for the ATR basal-activity in regulating the levels of RPA at forks.
(A) Overlaid PCNA-RPA-MCM TCF-resolved single-replisome configurations from SMLM images of single cells under different treatments as indicated. Circle size represents the average density of RPA at each fork within a nucleus.
(B) Quantification of the levels of RPAfork for the TCF-resolved single replisome configurations shown in (A) reveals that ATRIP is necessary for the ATR basal activity in regulating the RPA level at forks. Mean values and the 1st and 3rd quartile were marked as black and colored bars, respectively, N = 38, 46, 29, and 47 for siCTRL-NT, siCTRL-ATRi, siATRIP-NT, and siATRIP-ATRi, respectively. Right panel: quantification of the abundance ratio between data as indicated. Error bars in log (Abundance Ratio) is the propagated SEM.
(C) Schematic illustration of ATR basal activity mediated by ATRIP for regulating RPA levels at replication forks.

