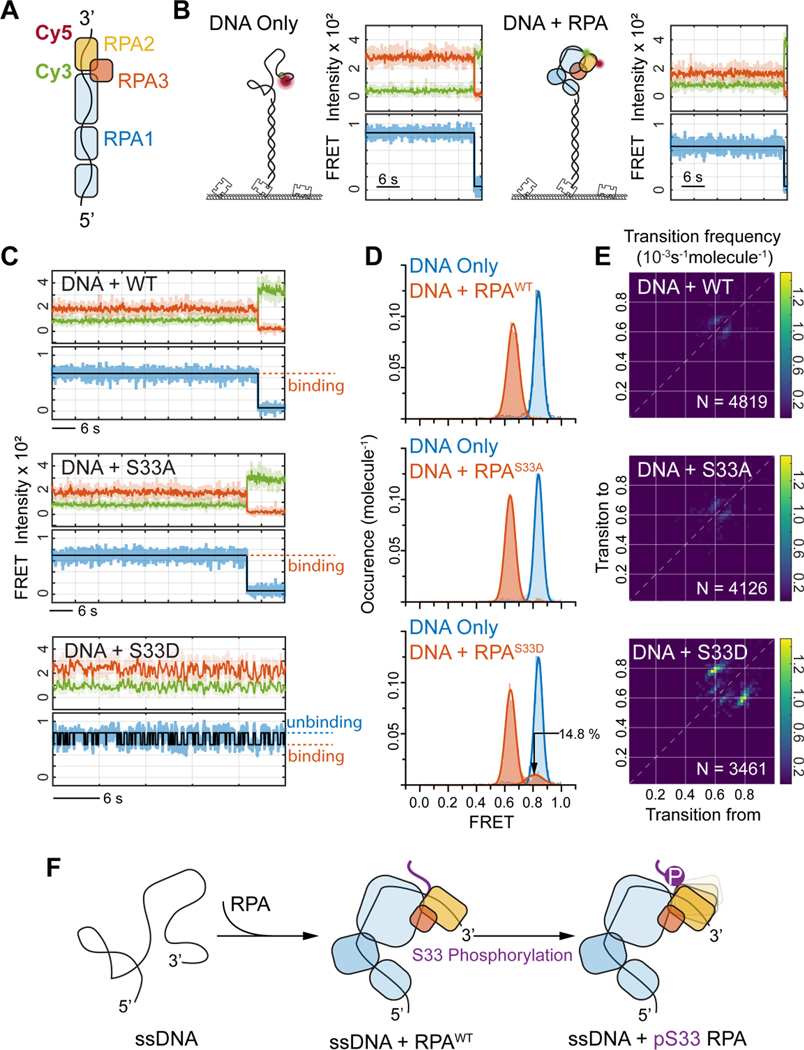
Figure 5. RPA2 S33 phosphorylation affects the coordination of ssDNA bound RPA.
(A) Schematic illustration of the single-molecule FRET assay for probing RPA2 coordination for ssDNA bound RPA trimer. The Cy3-Cy5 FRET reporter was labeled at the 3’-end of the 32nt-long ssDNA, with 12nt distancing in between, so that the changes in FRET efficiency represents altered coordination of RPA2 on ssDNA.
(B) Representative smFRET trajectories for DNA-Only (left panel) and with RPA with WT RPA2 bound (right panel).
(C) Representative smFRET trajectories of ssDNA bound by WT RPA (top panel) or by RPA with RPA2 S33A (middle panel) and RPA2 S33D (bottom panel). The smFRET trajectory for RPA2 S33D displays fluctuation in FRET signal indicating that phosphorylation of RPA2 at S33 reduces its coordination on ssDNA.
(D) FRET histograms for ssDNA bound RPA showing the specific FRET states (in red) for WT (top), S33A (middle) and S33D (bottom) as compared to ssDNA only (blue), revealing that S33D also populates unbound state corresponding to binding fluctuations of the phosphorylated RPA2 onto ssDNA.
(E) The Transition Density Plot (TDP) generated from HMM analysis of smFRET trajectories for the ssDNA bound RPA with WT (top), S33A (middle) and S33D (bottom) RPA2. This shows specific transitions for S33D corresponding to RPA2-ssDNA binding fluctuations. N provides the number of trajectories analyzed by HMM to generate the TPD analysis for each condition.
(F) Schematic illustration of the observed binding fluctuations of RPA2 domain onto ssDNA via Ser-33 phosphorylation.

