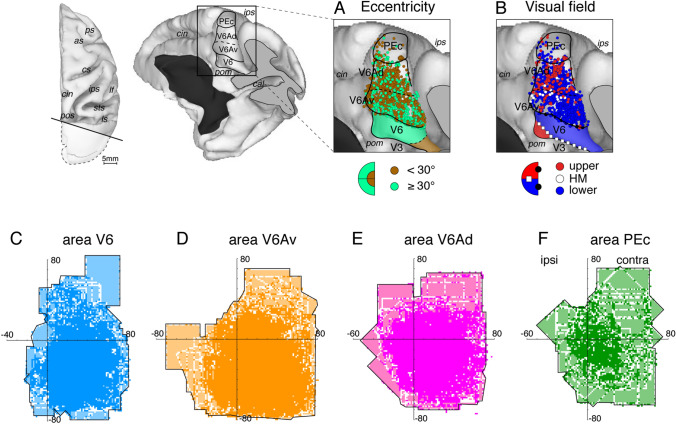
Fig. 3.
Visuotopic organization and visual field representation in macaque areas V6, V6A and PEc. Dorsal and posteromedial views of a 3D reconstruction of a macaque right hemisphere showing the locations of areas V6, V6Av, and V6Ad in the anterior bank of POs, and the nearby area PEc on the dorsal surface of the SPL. The occipital pole (highlighted in white in the dorsal view) was cut away to show the anterior bank of POs. A Distribution in V6A and PEc of visual cells with receptive fields in the central (< 30°; brown dots) and peripheral (> 30°; teal dots) parts of the visual field, respectively. Brown and teal areas in V6 indicate the progression of receptive field eccentricity in the different parts of V6, according to the color coding shown at the bottom. B Distribution in V6A and PEc of visual cells with receptive fields in the lower (blue dots) or upper (red dots) visual field. White dots indicate receptive fields located on the horizontal meridian. Blue and red areas in V6 indicate the progression of visual field representation in different parts of V6 according to the color coding shown at the bottom. White squares and black circles represent the HM and VM meridians of area V6. Data obtained from the following studies (Gamberini et al. 2015, 2018). C–F Distribution of receptive fields (light blue for V6 = 492, orange for V6Av = 585, pink for V6Ad = 324 and green for PEc = 56) with an outline of the most peripheral receptive field borders. The parts of the visual field where the receptive fields are more numerous and superimposed are represented with darker colors. Other abbreviations as in Fig. 1

