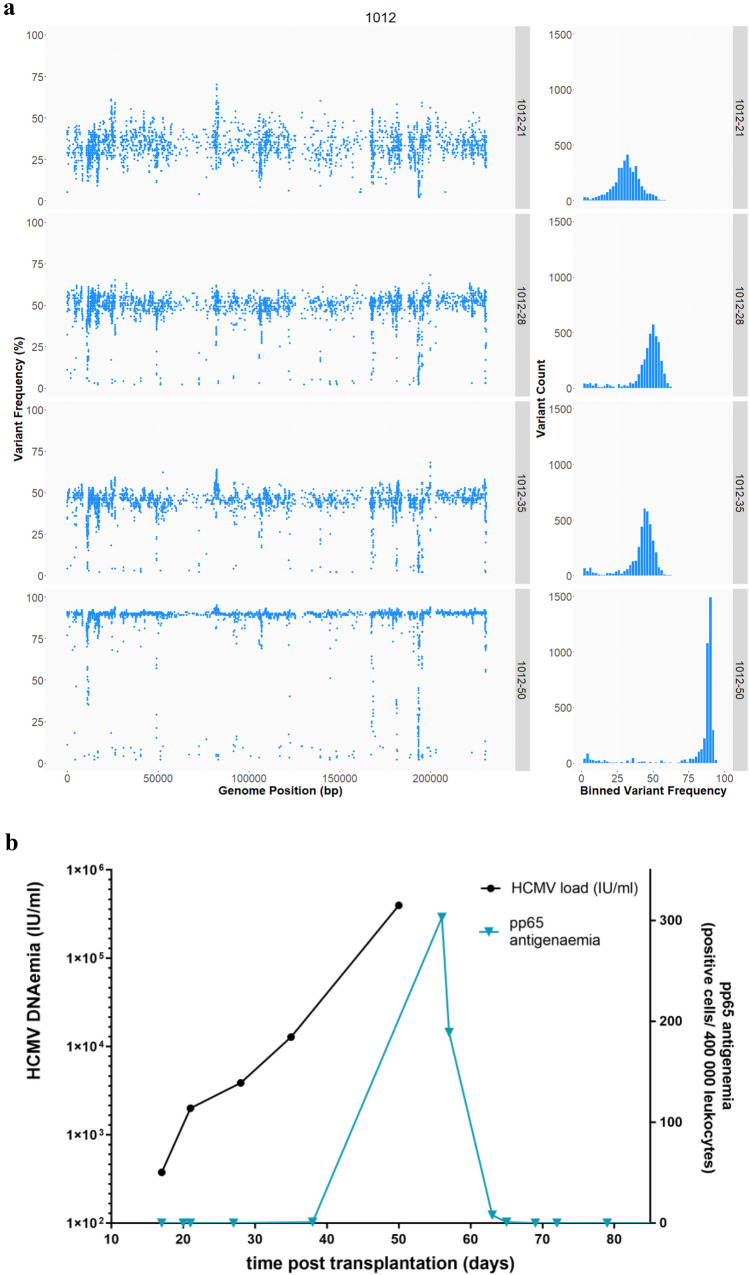
Fig. 2.
Longitudinal HCMV sequence diversity in recipient 1012. a Variant analysis was conducted in relation to the consensus sequence from day 21. The frequency of variants (Y-axis) was plotted against the position on the genome (X-axis). The histogram on the left shows the variants binned according to their frequency percentage (X-axis) plotted against the absolute number of variants (Y-axis). b HCMV DNA load (IU/ml, left Y-axis) and pp65 antigenaemia (positive cells/400,000 leukocytes, right Y-axis) in plasma were plotted against time after transplantation (days, X-axis). Samples from four time points (days 21, 28, 35 and 50 post-transplantation) were sequenced

