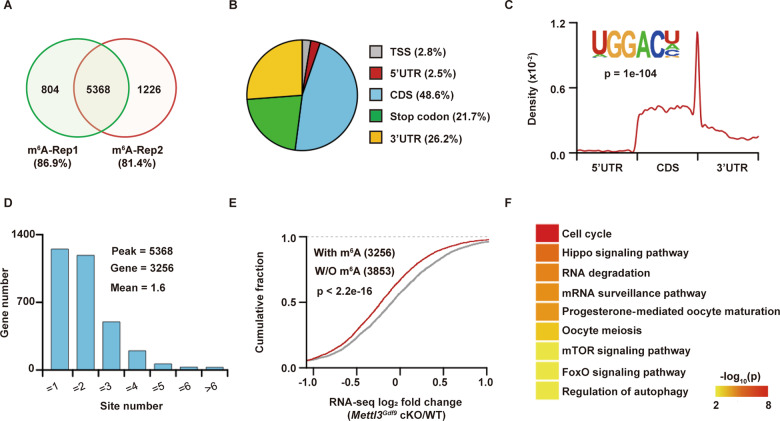
Fig. 4. Characteristics of METTL3-mediated m6A at the GV stage.
A Venn diagram showing the overlay of m6A peaks in transcripts between two independent biological replicates. B Pie plot showing the percentages of m6A peaks on distinct mRNA segments: the TSS, 5′ untranslated region (5′UTR), CDS, stop codon, and 3′ untranslated region (3′UTR). C The m6A motif of GV oocytes enriched with HOMER (inner panel). The distribution pattern displays the position density of m6A across the 5′UTR, CDS, and 3′UTR of mRNAs (outer panel). D Bar plot showing the numbers of transcripts with different numbers of m6A peaks. E Cumulative distribution showing the differences (log2 (fold change) values) in transcript expression between Mettl3Gdf9 cKO and WT oocytes. The transcripts were classified as m6A and non-m6A by MeRIP-seq. The p value was determined with the two-sided Kolmogorov–Smirnov test. F Heatmap showing the significantly enriched KEGG pathways regulated by transcripts with m6A modification.

