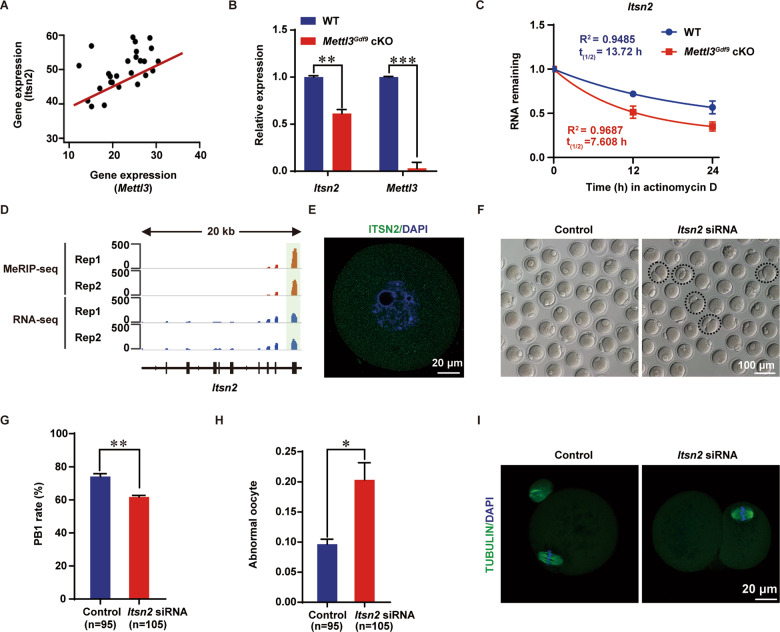
Fig. 6. METTL3 regulates oocyte maturation by targeting m6A modification on Itsn2.
A Scatter plot showing the Pearson correlation of RNA abundance between Itsn2 and Mettl3. B qRT-PCR analysis of Itsn2 and Mettl3 mRNA levels in oocytes from 3-week-old WT and Mettl3Gdf9 cKO mice. The relative mRNA levels of Itsn2 and Mettl3 in WT oocytes were set to 1.0. **p < 0.01; ***p < 0.001 by two-tailed Student’s t-test. Data represent the mean ± SEM (n = 3). C qRT-PCR analysis of Itsn2 mRNA stability in growing oocytes of WT and Mettl3Gdf9 cKO mice. Data were presented as means ± SEM, n = 3. D Integrated genomics viewer (IGV) plot showing the m6A peak across Itsn2 mRNA transcript; the green box represents the m6A peak identified by MeRIP-seq. E Confocal immunofluorescence staining for ITSN2 (green) in oocytes. DAPI was used to stain nuclei (blue). Scale bar, 20 μm. F Images of control siRNA (Control) and Itsn2 siRNA microinjected oocytes. Dashed circles indicate oocytes with big polar body or symmetrical division. Scale bar, 100 μm. G, H Rates of PB1 formation and abnormal oocytes after Itsn2 siRNA and control siRNA (Control) microinjection. Control siRNA microinjected oocytes, n = 95; Itsn2 siRNA microinjected oocytes, n = 105. *p < 0.05; **p < 0.01 by two-tailed Student’s t-test. Data represent the mean ± SEM (n = 3). I Confocal immunofluorescence staining with α-Tubulin antibody (green) and DAPI (blue) for Itsn2 siRNA and control siRNA microinjected oocytes. Scale bar, 20 μm.

