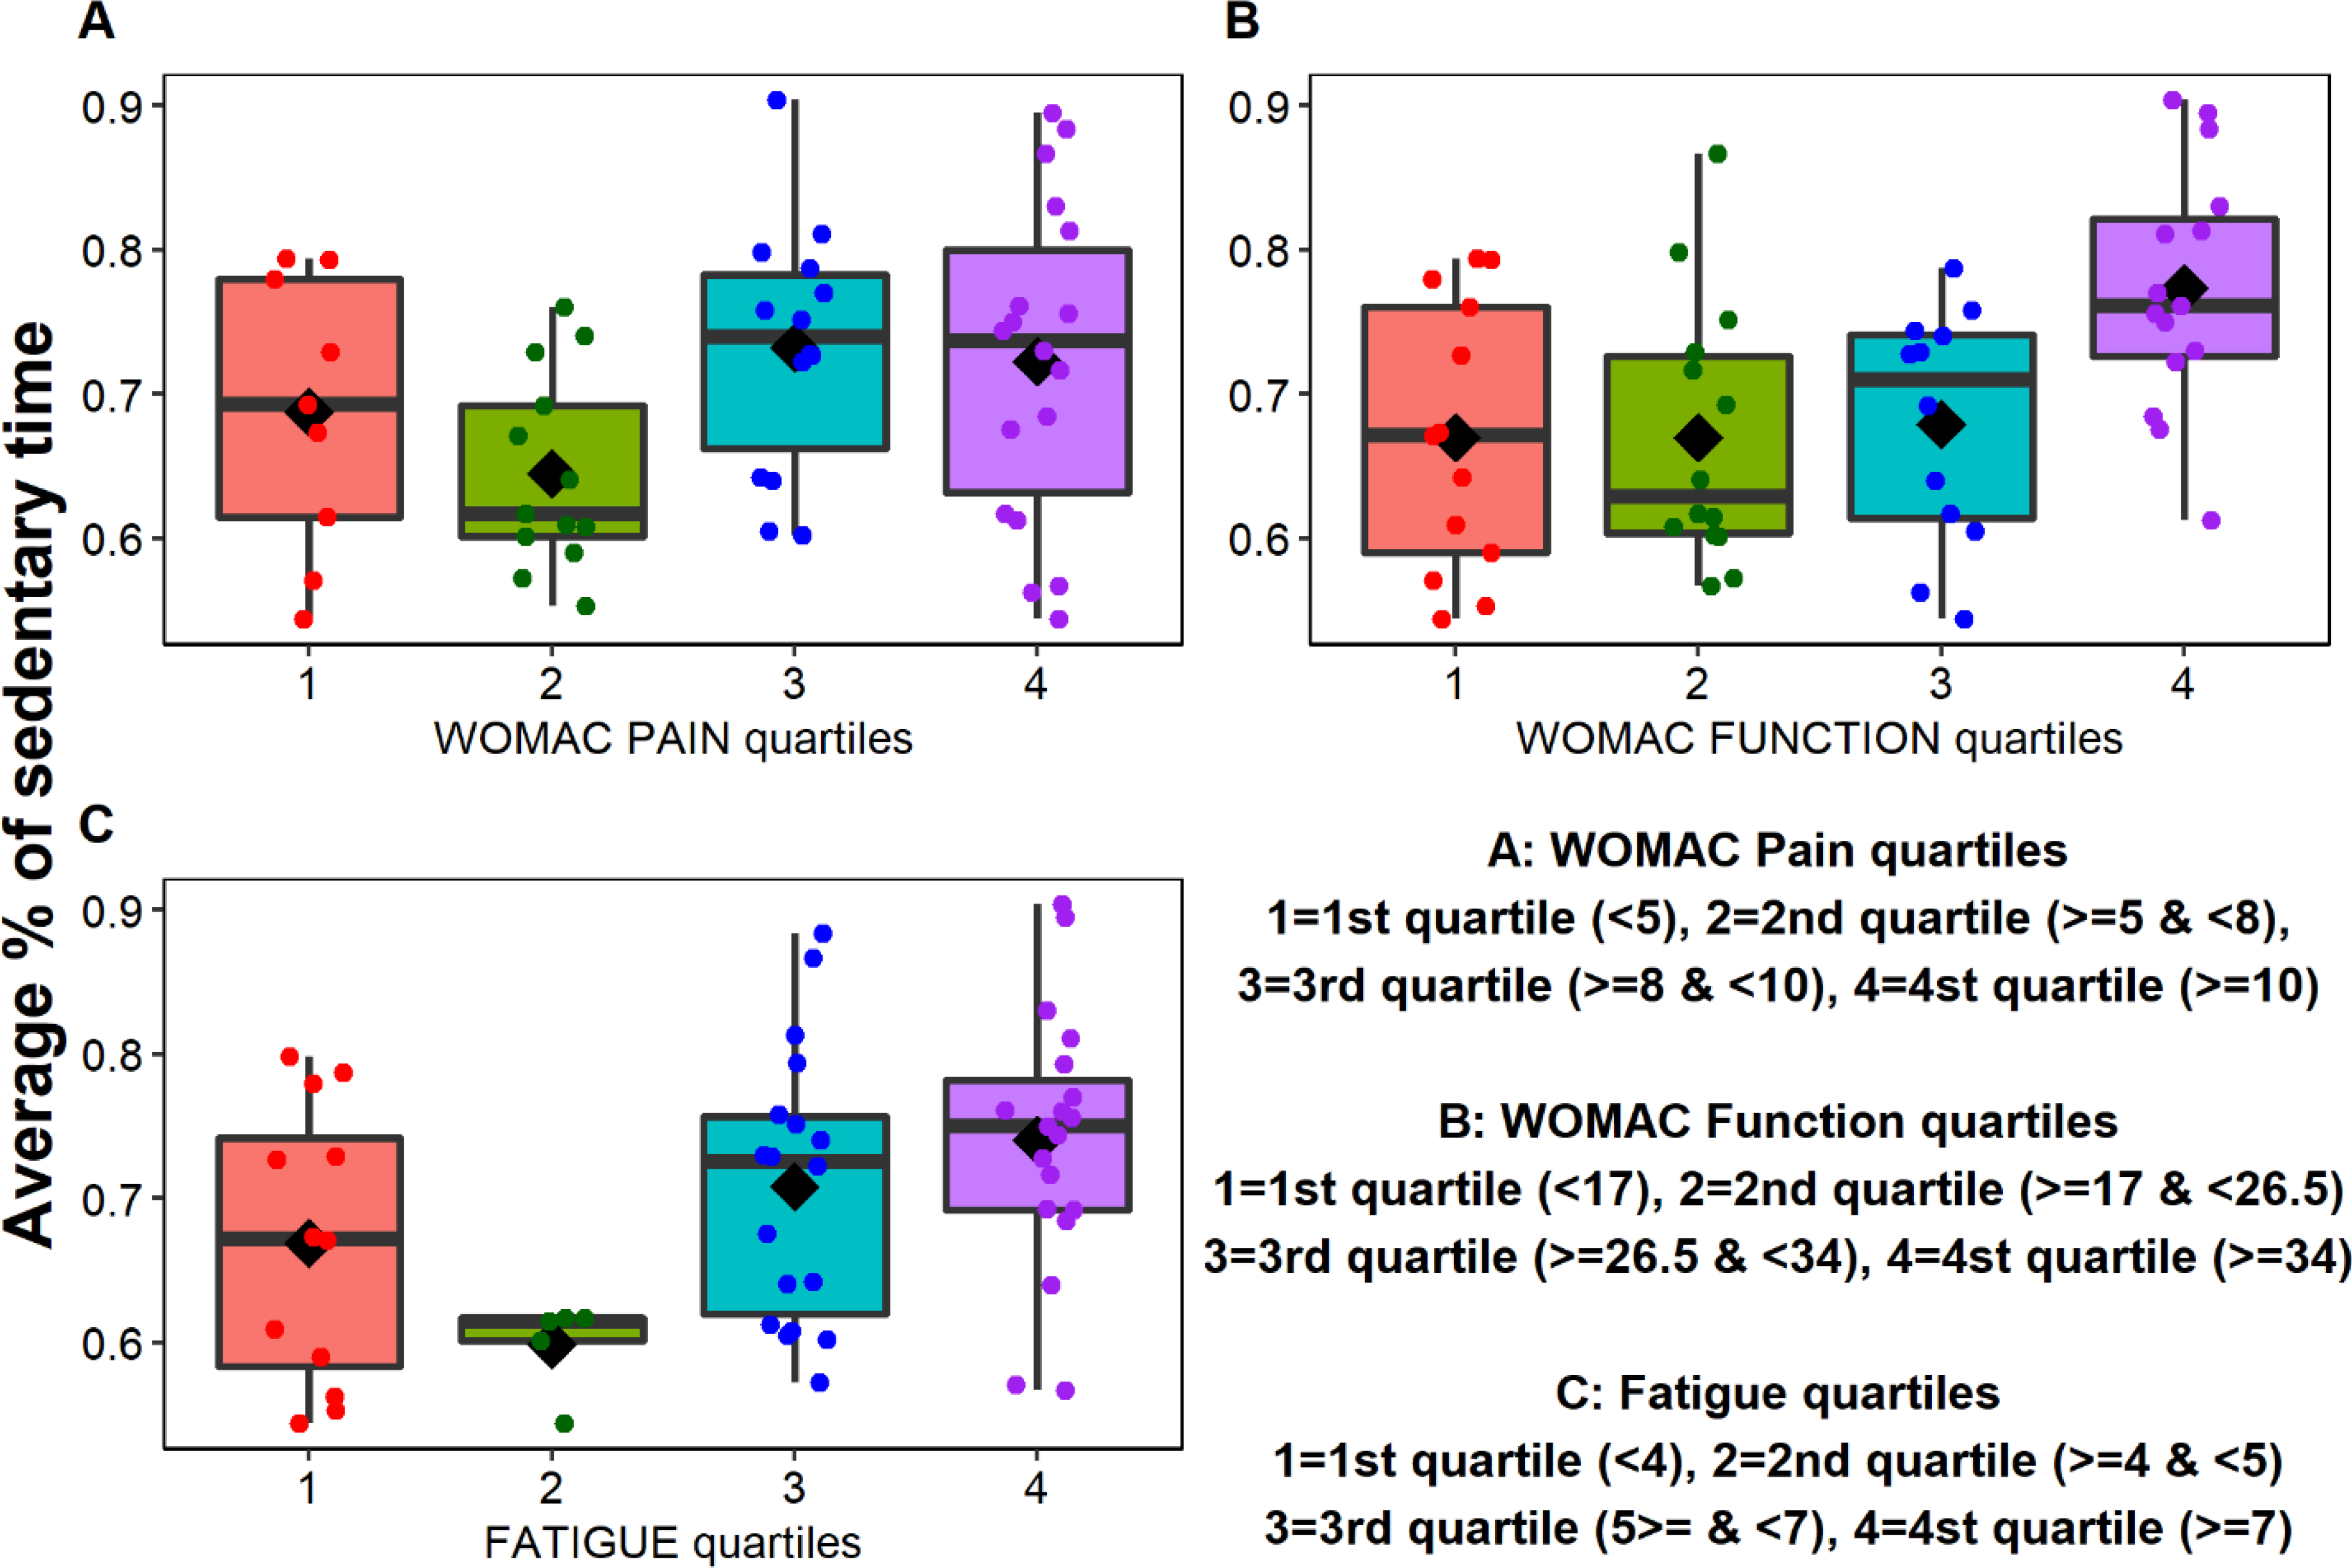
Figure 2.

Proportion of afternoon time spent in sedentary behavior, based on quartiles of (A) WOMAC pain scores, (B) WOMAC function scores, and (C) fatigue scores. The boxplots show the mean (◇) and median (horizontal line drawn within the box); the dots are individual data points. The “whiskers” (the lines extending parallel from the boxes) indicate variability outside the upper and lower quartiles.
