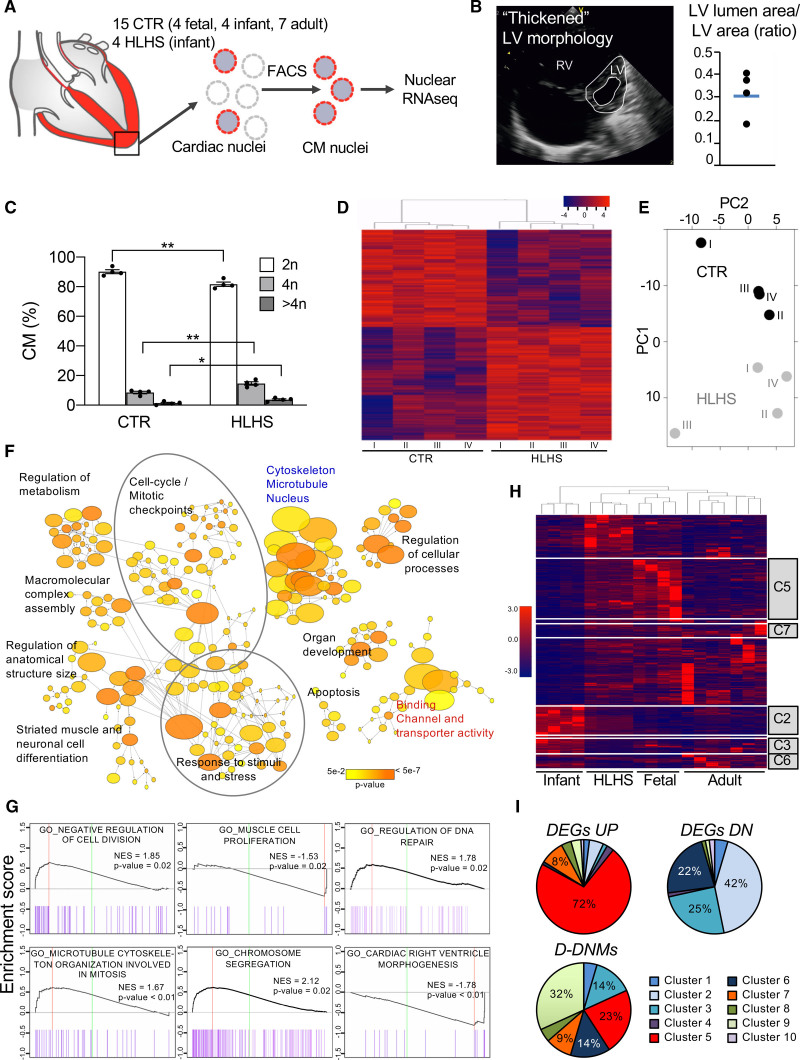
Figure 2.
Gene expression analysis of cardiomyocyte nuclei from hypoplastic left heart syndrome and control hearts. A, Workflow of cardiomyocyte nuclei isolation for RNA sequencing (RNA-Seq). B, Representative echocardiogram of patients with hypoplastic left heart syndrome (HLHS) with a distinct left ventricular (LV) phenotype. Dot plot shows the ratio of LV lumen area/LV area for the 4 patients with HLHS and the average value (blue line). C, Ploidy level of cardiomyocyte nuclei in HLHS and control (CTR) hearts. Data are mean±SEM. *P<0.05, **P<0.01 (t test). D, Heatmap depicting normalized RNA-Seq expression values of differentially expressed genes (DEGs; 1.5-fold expression, P≤0.05). Gene regulations are reported as a color code and hierarchical clustering result as a dendrogram. E, Principal component analysis performed on rlog-normalized (DESeq2) counts for all nuclear RNA-Seq samples. F, Network visualization of the enriched Gene Ontology (GO) of HLHS DEGs using the Cytoscape plugins BinGO. Nodes represent enriched GO terms, node size corresponds to the gene number, and color intensity to the P value. Edges represent GO relation of biological process (black), molecular function (red), and cellular component (blue). G, Representative enrichment plots from gene set enrichment analysis. Normalized enrichment score (NES) and P value are specified. H, Heatmap illustrating the expression of HLHS DEGs during fetal, infant, and adult stages of normal cardiac development. The dendrogram shows clustering of the HLHS infant samples with control fetal samples. Genes belonging to developmentally regulated gene clusters from Figure IIIC in the Data Supplement are highlighted. I, Pie charts showing the percentage of HLHS upregulated (DEGs UP), downregulated (DEGs DN), and damaging de novo affected (D-DNM) genes belonging to the developmentally regulated gene clusters from Figure IIIC in the Data Supplement. CM indicates cardiomyocytes; FACS, fluorescence-activated cell sorting; and RV, right ventricle.

