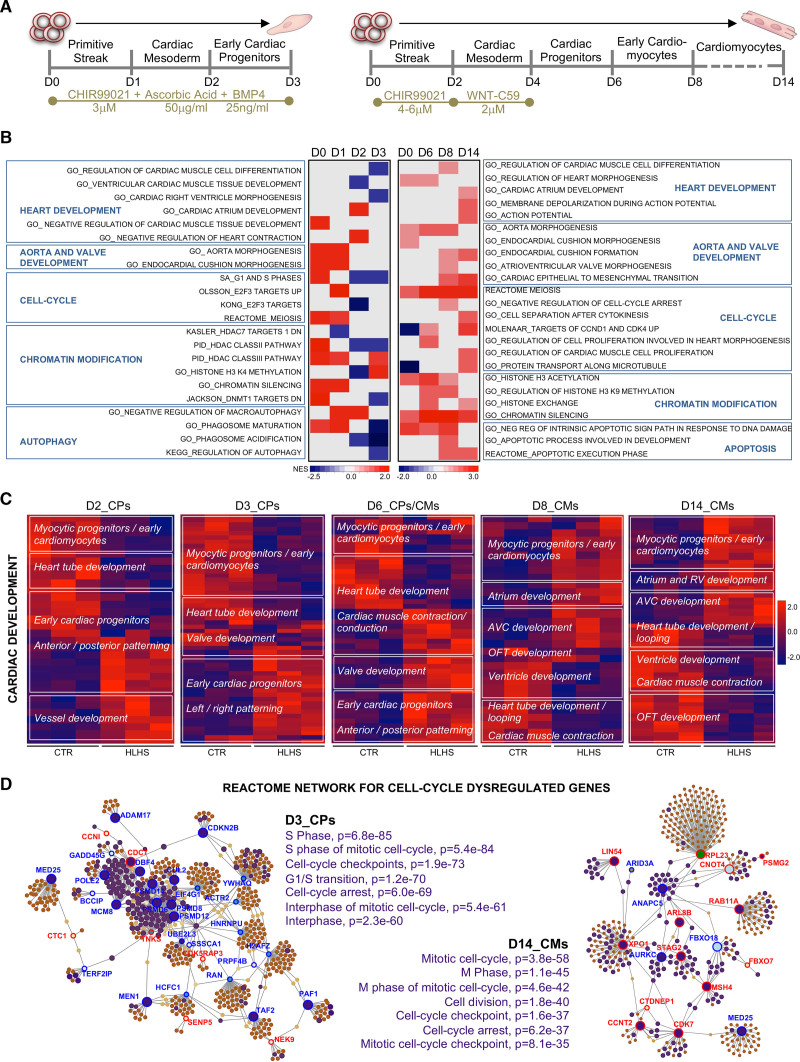
Figure 3.
Gene expression analysis during induced pluripotent stem cell–based cardiogenesis reveals networks of dysregulated genes in hypoplastic left heart syndrome. A, Directed induced pluripotent stem cell cardiac differentiation protocols used in the study. B, Heatmap of normalized enrichment scores for selected gene set enrichment analysis terms. Red and blue denote terms with positive and negative normalized enrichment scores, respectively. C, Heatmaps showing gene expression of differentially expressed genes (1.5-fold expression, P≤0.05) involved in cardiac development at the indicated days of differentiation. Values are row-scaled to show their relative expression. Blue and red are low and high levels, respectively. D, Network analyst–generated protein–protein interactome of differentially expressed genes involved in cell cycle at day 3 and day 14. Upregulated (red) and downregulated (blue) genes are shown. In purple are highlighted the genes belonging to the enriched Gene Ontology categories specified on the side of the plots. Protein–protein interactions are indicated as solid gray lines between genes. AVC indicates atrioventricular canal; CM, cardiomyocytes; CP, cardiac progenitor; CTR, control; HLHS, hypoplastic left heart syndrome; OFT, outflow tract; and RV, right ventricle.

