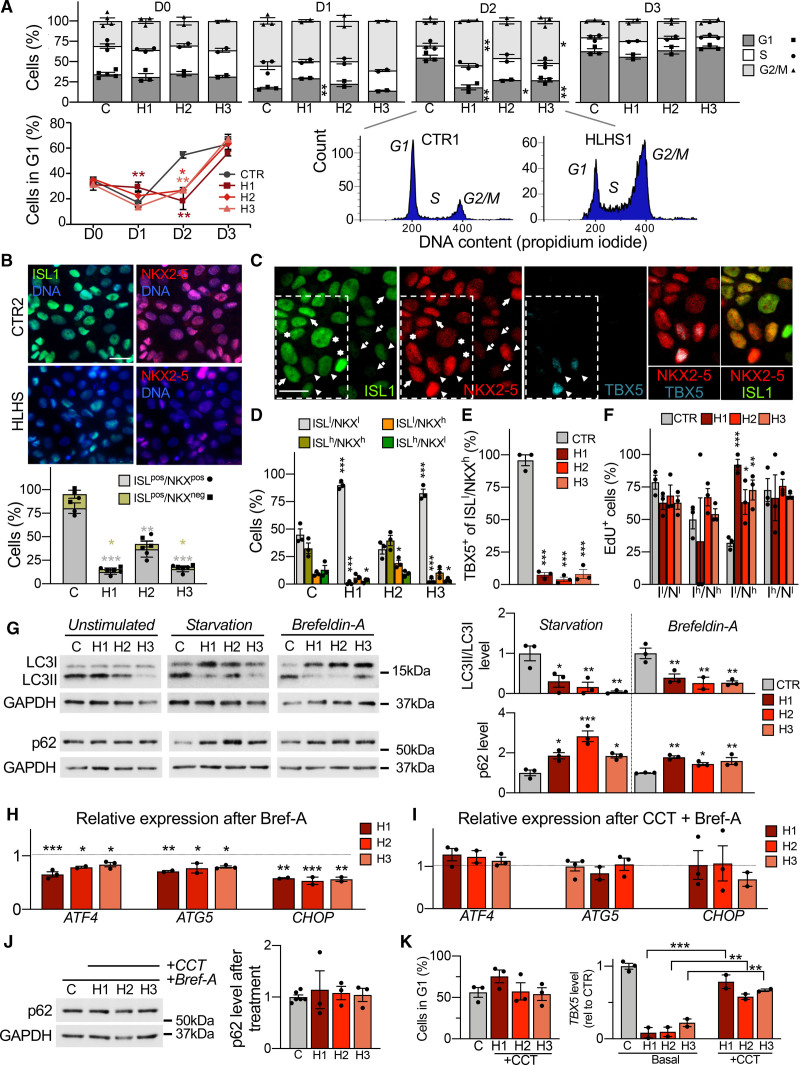
Figure 4.
Defects in unfolded protein response and autophagy delay and disrupt cardiac progenitor lineage specification. To better discriminate possible phenotypic variations among diseased lines, functional results from each hypoplastic left heart syndrome (HLHS) line are shown separately. Data from control lines have been combined. A, Propidium iodide staining analysis of HLHS (H) and control cells (C) during cardiac progenitor (CP) differentiation. Data are mean±SEM; 2 to 4 differentiations per line, N≥20 000 cells per sample at each time point. *P<0.05, **P<0.01 compared with controls (CTR; 2-way analysis of variance [ANOVA]). B, Immunofluorescence analysis of ISL1 and NKX2-5 in HLHS and control CPs at day 2. Scale bar, 25 µm. Data are mean±SEM; 431 (CTR), 463 (HLHS1), 442 (HLHS2), and 396 (HLHS3) cells from 3 differentiations per line. *P<0.05, **P<0.01, ***P<0.001 compared with CTR (1-way ANOVA). C, Representative immunofluorescence of ISL1, NKX2-5, and TBX5 in control CPs (CTR3) at day 3. Four ISL1/NKX2-5 expression patterns are highlighted: ISL1low/NKX2-5low (dotted arrows), ISL1high/NKX2-5high (arrows), ISL1high/NKX2-5low (asterisks), and ISL1low/NKX2-5high (arrowheads). Scale bar, 20 µm. D, Distribution of cells with ISL1/NKX2-5 expression patterns from (C) in HLHS and control CPs at day 3. Data are mean±SEM; 369 (CTR), 347 (HLHS1), 322 (HLHS2), 357 (HLHS3) cells from 3 differentiations per line. *P<0.05, ***P<0.001 compared with CTR (1-way ANOVA). E, Percentage of ISL1low/NKX2-5high cells expressing TBX5 in HLHS and control CPs at day 3. Data are mean±SEM; 114 (CTR), 70 (HLHS1), 182 (HLHS2), and 123 (HLHS3) cells from 3 differentiations per line. ***P<0.001 compared with CTR (1-way ANOVA). F, Quantification of EdU+ cells in HLHS and control CP subpopulations at day 3. Data are mean±SEM; 369 (CTR), 347 (HLHS1), 322 (HLHS2), 357 (HLHS3) cells from 3 differentiations per line. *P<0.05, **P<0.005, ***P<0.001 compared with CTR (1-way ANOVA). G, Western blot of LC3 and p62 in HLHS and control CPs at day 3 with and without starvation or brefeldin-A. For detection of LC3, all 3 conditions were carried out in presence of chloroquine. Data are mean±SEM; 2 to 3 differentiations per line. *P<0.05, **P<0.01, ***P<0.001 compared with CTR (1-way ANOVA). H and I, Expression analysis of ATF4 and its downstream targets ATG5 and CHOP in HLHS and control CPs at day 3 after treatment with brefeldin-A alone (H) or in combination with the PERK activator CCT020312 (I). Shown are expression levels relative to controls. Data are mean±SEM; 2 to 4 differentiations per line. *P<0.05, **P<0.01, ***P<0.001 compared with CTR (1-way ANOVA). J, Western blot of p62 in HLHS and control CPs at day 3 after treatment with brefeldin-A and CCT020312. Data are mean±SEM; 3 to 6 differentiations per line. K, Propidium iodide staining–based quantification of cells in G1 phase in HLHS and control CPs at day 2 (left) and TBX5 expression by qRT-PCR at day 3 (right) after 6-hour treatment of HLHS cells with CCT020312 at day 1.5. Data are mean±SEM; 2 to 3 differentiations per line, N≥20 000 cells per sample in left panel. **P<0.01, ***P<0.001 compared with own basal (1-way ANOVA).

