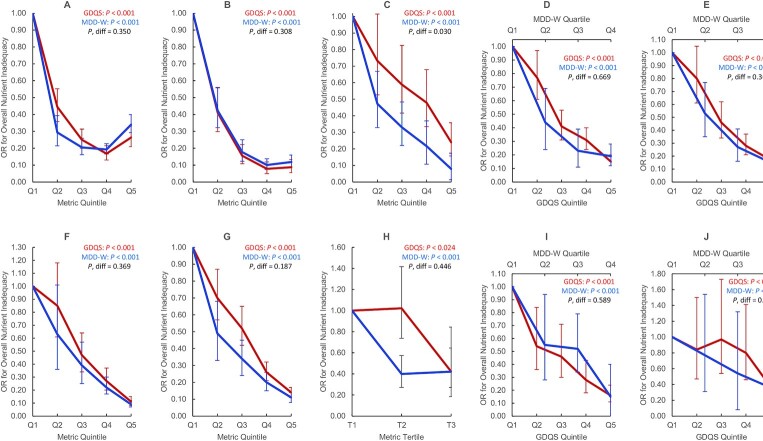
FIGURE 1.
Covariate-adjusted ORs for binary overall nutrient inadequacy by GDQS and MDD-W quintile, quartile, or tertile in nonpregnant nonlactating women of reproductive age in the total population or within urban stratum and rural strata of cross-sectional datasets. We defined several aggregate measures of protein, fiber, calcium, iron, zinc, vitamin A, folate, and vitamin B12 adequacy. In FFQ analysis, a continuous overall nutrient adequacy variable was first constructed for each participant in the data, based on the number of nutrients (out of 8) meeting age- and sex-specific EARs from the Institute of Medicine (or adequate intake level, in the case of fiber) (39); iron adequacy was defined as ≥50% probability of adequacy based on a lognormal requirement distribution (40). In 24HR analysis [based on 3-day averages (China) or estimated usual intakes based on the ISU method (Mexico) (41)], probability of adequacy for all nutrients was estimated using the full probability method (40). Iron requirement distributions and zinc EARs were adjusted to account for absorption characteristics of local diets (40,42–44). Because nutrient requirements are age-specific, they indirectly account for age differences in energy intake to an extent, but not entirely. To account for residual confounding by energy, we therefore adjusted overall nutrient adequacy for energy using the residual method (45), and added the resulting residuals back to the mean of the raw overall nutrient adequacy variable. We derived a binary measure of overall nutrient inadequacy defined as <4 adequate nutrients (in FFQ data) or < 50% mean probability of adequacy (in 24HR data). We also derived a binary measure of energy-adjusted overall nutrient inadequacy (shown in this figure) by adjusting the continuous overall nutrient adequacy variable for energy using the residual method, ranking the residuals, and assigning a value of 1 to those in the top Xth percentile and 0 to those in the bottom, in which X is the proportion of individuals in the raw data with <4 adequate nutrients (in FFQ data) or <50% mean probability of adequacy (in 24HR data). Energy-adjusted overall nutrient inadequacy therefore preserves the distribution of raw overall nutrient inadequacy. This figure displays linear trends in overall nutrient inadequacy across metric quintiles (P), statistically compared using regression models in which quintiles of 2 metrics are included in the same model and the parameter estimates associated with quintile 5 are compared using a Wald test (P, diff) (35). Models were adjusted for age (India and Millennium Villages); age, urban/rural locality, education, marital status, occupation (Ethiopia); age, socioeconomic status, education, physical activity, smoking, alcohol use, occupation, urban/rural locality (China); age, socioeconomic status, urban/rural locality (Mexico). Trends did not differ between GDQS and MDD-W, except in analysis of Ethiopia FFQ data (in which the MDD-W was more predictive). Due to limited variation across metric quintiles, MDD-W is presented in terms of quartiles in Mexico FFQ and 24HR data, and tertiles in Ethiopia 24HR data. India Total Population FFQ (n = 3065) (A), Millennium Villages Project Rural FFQ (n = 1624) (B), Ethiopia Total Population FFQ (n = 1604) (C), Mexico Urban FFQ (n = 2766) (D), Mexico Rural FFQ (n = 2209) (E), China Urban 24HR (n = 7047) (F), China Rural 24HR (n = 8126) (G), Ethiopia Total Population 24HR (n = 1593) (H), Mexico Urban 24HR (n = 1515) (I), Mexico Rural 24HR (n = 1030) (J). EAR, estimated average requirement; GDQS, Global Diet Quality Score; MDD-W, Minimum Dietary Diversity – Women; 24HR, 24-h recall.

