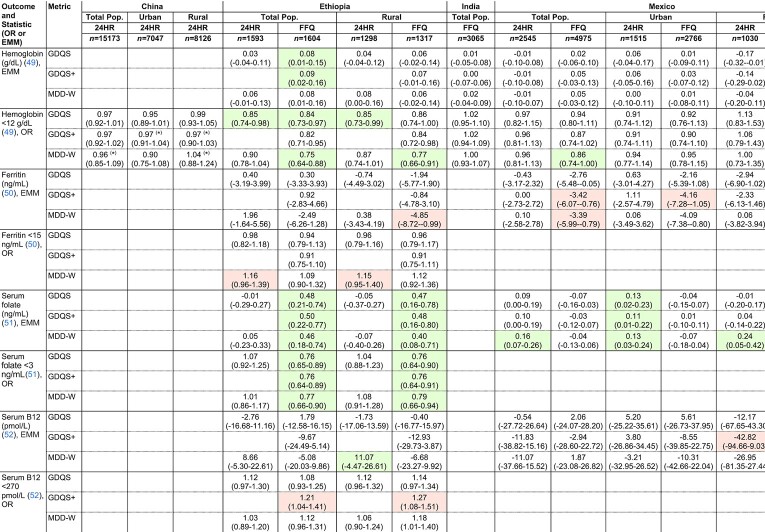
TABLE 7.
Covariate-adjusted associations between the GDQS, GDQS+, and MDD-W compared with biochemical outcomes related to nutrient adequacy among nonpregnant nonlactating women of reproductive age in the total population or within urban stratum and rural strata of cross-sectional datasets1
Values presented as ORs or estimated marginal means (EMM) (95% CI) per 1-SD increase in metrics. ORs and EMMs are estimated from covariate-adjusted regression models of associations between metrics (expressed in quintiles) and continuous outcomes, or dichotomous outcomes defined according to clinically relevant cutoffs. See footnote to Figure 1 for adjustment covariates. Color indicates statistically-significant linear trend across metric quintiles (P < 0.05) (green: protective, red: deleterious). *P < 0.05 for Wald test comparing trends between the GDQS and other metrics. Sample size corresponds to the number of participants with dietary data [for some outcomes, available sample size was smaller; refer to (25–33) for more details]. EMM. estimated marginal mean; GDQS, Global Diet Quality Score; MDD-W, Minimum Dietary Diversity – Women; MVP, Millennium Villages Project; 24HR, 24-hour recall.

