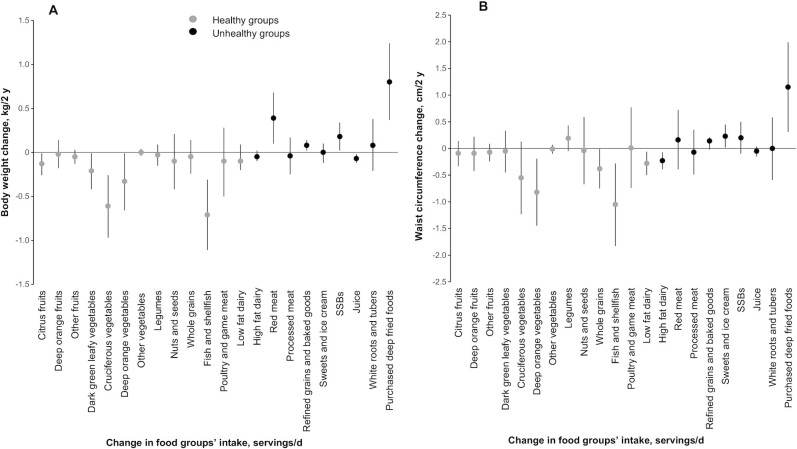
FIGURE 1.
Relation between change in consumption of food groups (servings/d) and weight (A) and waist circumference (B) change within a 2-y period: Mexican Teachers’ Cohort. Values were adjusted for baseline age (continuous); change in energy (continuous); state (Jalisco, Veracruz); 2006 and 2008 physical activity (low, medium, high); marital status (single, living together, married, separated, widow); education (none, high school or less, undergraduate degree, graduate degree or above); baseline household assets (lowest, medium, highest); health insurance (public, private, other); baseline BMI (<25, 25–29.9, >30 kg/m2); and changes in smoking status (baseline past smokers, stayed nonsmokers, stayed smokers, quitters, starters) and alcohol consumption (baseline nondrinkers, stayed nondrinkers, stayed drinkers, quitters, starters). The model was mutually adjusted for other food groups. SSB, sugar-sweetened beverage.

