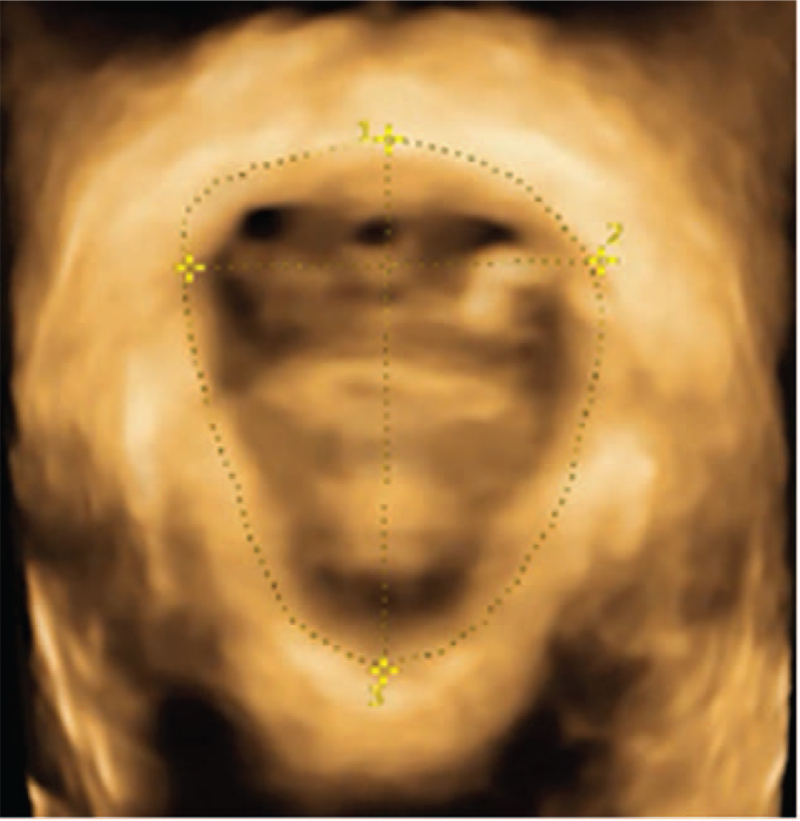
Figure 3.
Ultrasonic image taken in resting state. ∗ Represents that there is a significant difference in the decrease of group B compared with group A (P < .05). Schematic diagram of the measurement of the area for the levator ani hiatus (number 1), left and right diameters (number 2), and anteroposterior diameters (number 3) in the resting state (all measured values are normal).

