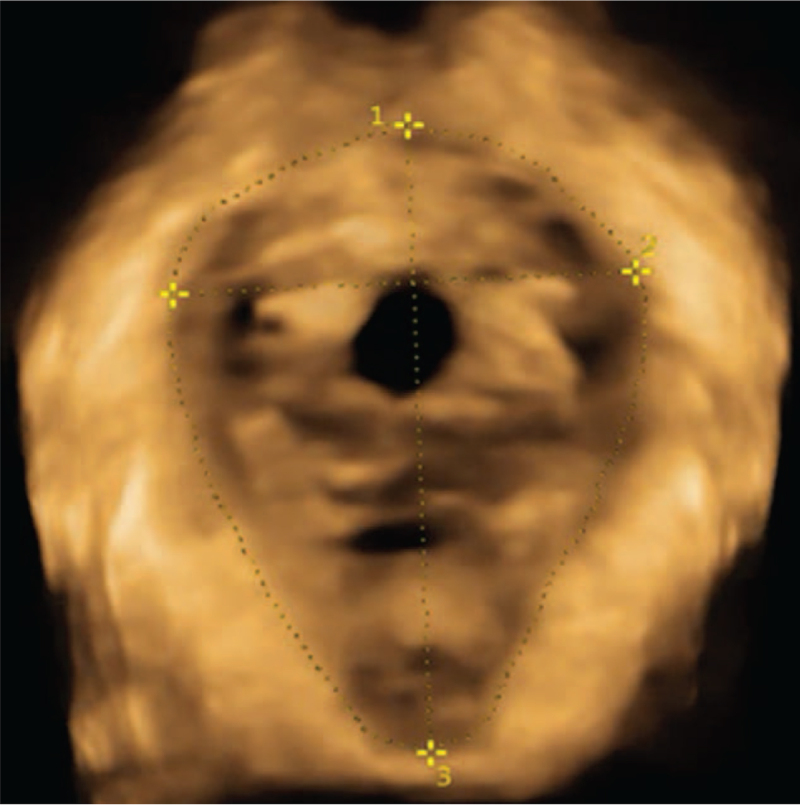
Figure 4.
Ultrasonic image taken in the state of Valsalva maneuver. ∗ Represents that there is a significant difference in the decrease of group B compared with group A (P < .05). Schematic diagram of measurement for levator ani hiatus area (number 1), left and right diameter (number 2), and anteroposterior diameter (number 3) under Valsalva action state (each measured value increases).

