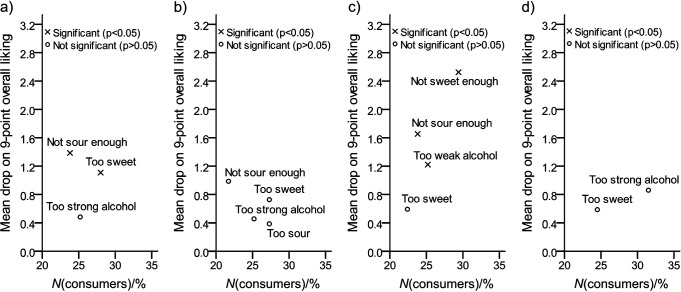
Fig. 1.
Mean drop analysis (N(consumer)=143) for the freshly prepared liqueur samples. A circle in the plot that shows statistically significant mean drop and a large percentage of consumers (above 20% in this case) is a cause for concern and suggests that the product should be modified in the appropriate direction. Liqueurs from the pomace of: a) apple, b) chokeberry, c) apple and beetroot (70:30) and d) apple and chokeberry (50:50), mean drop=the drop of the mean hedonic score calculated as the difference between the ’just-about-right’ consumer group and the ’too much’ or ’not enough of an attribute’ consumer groups

