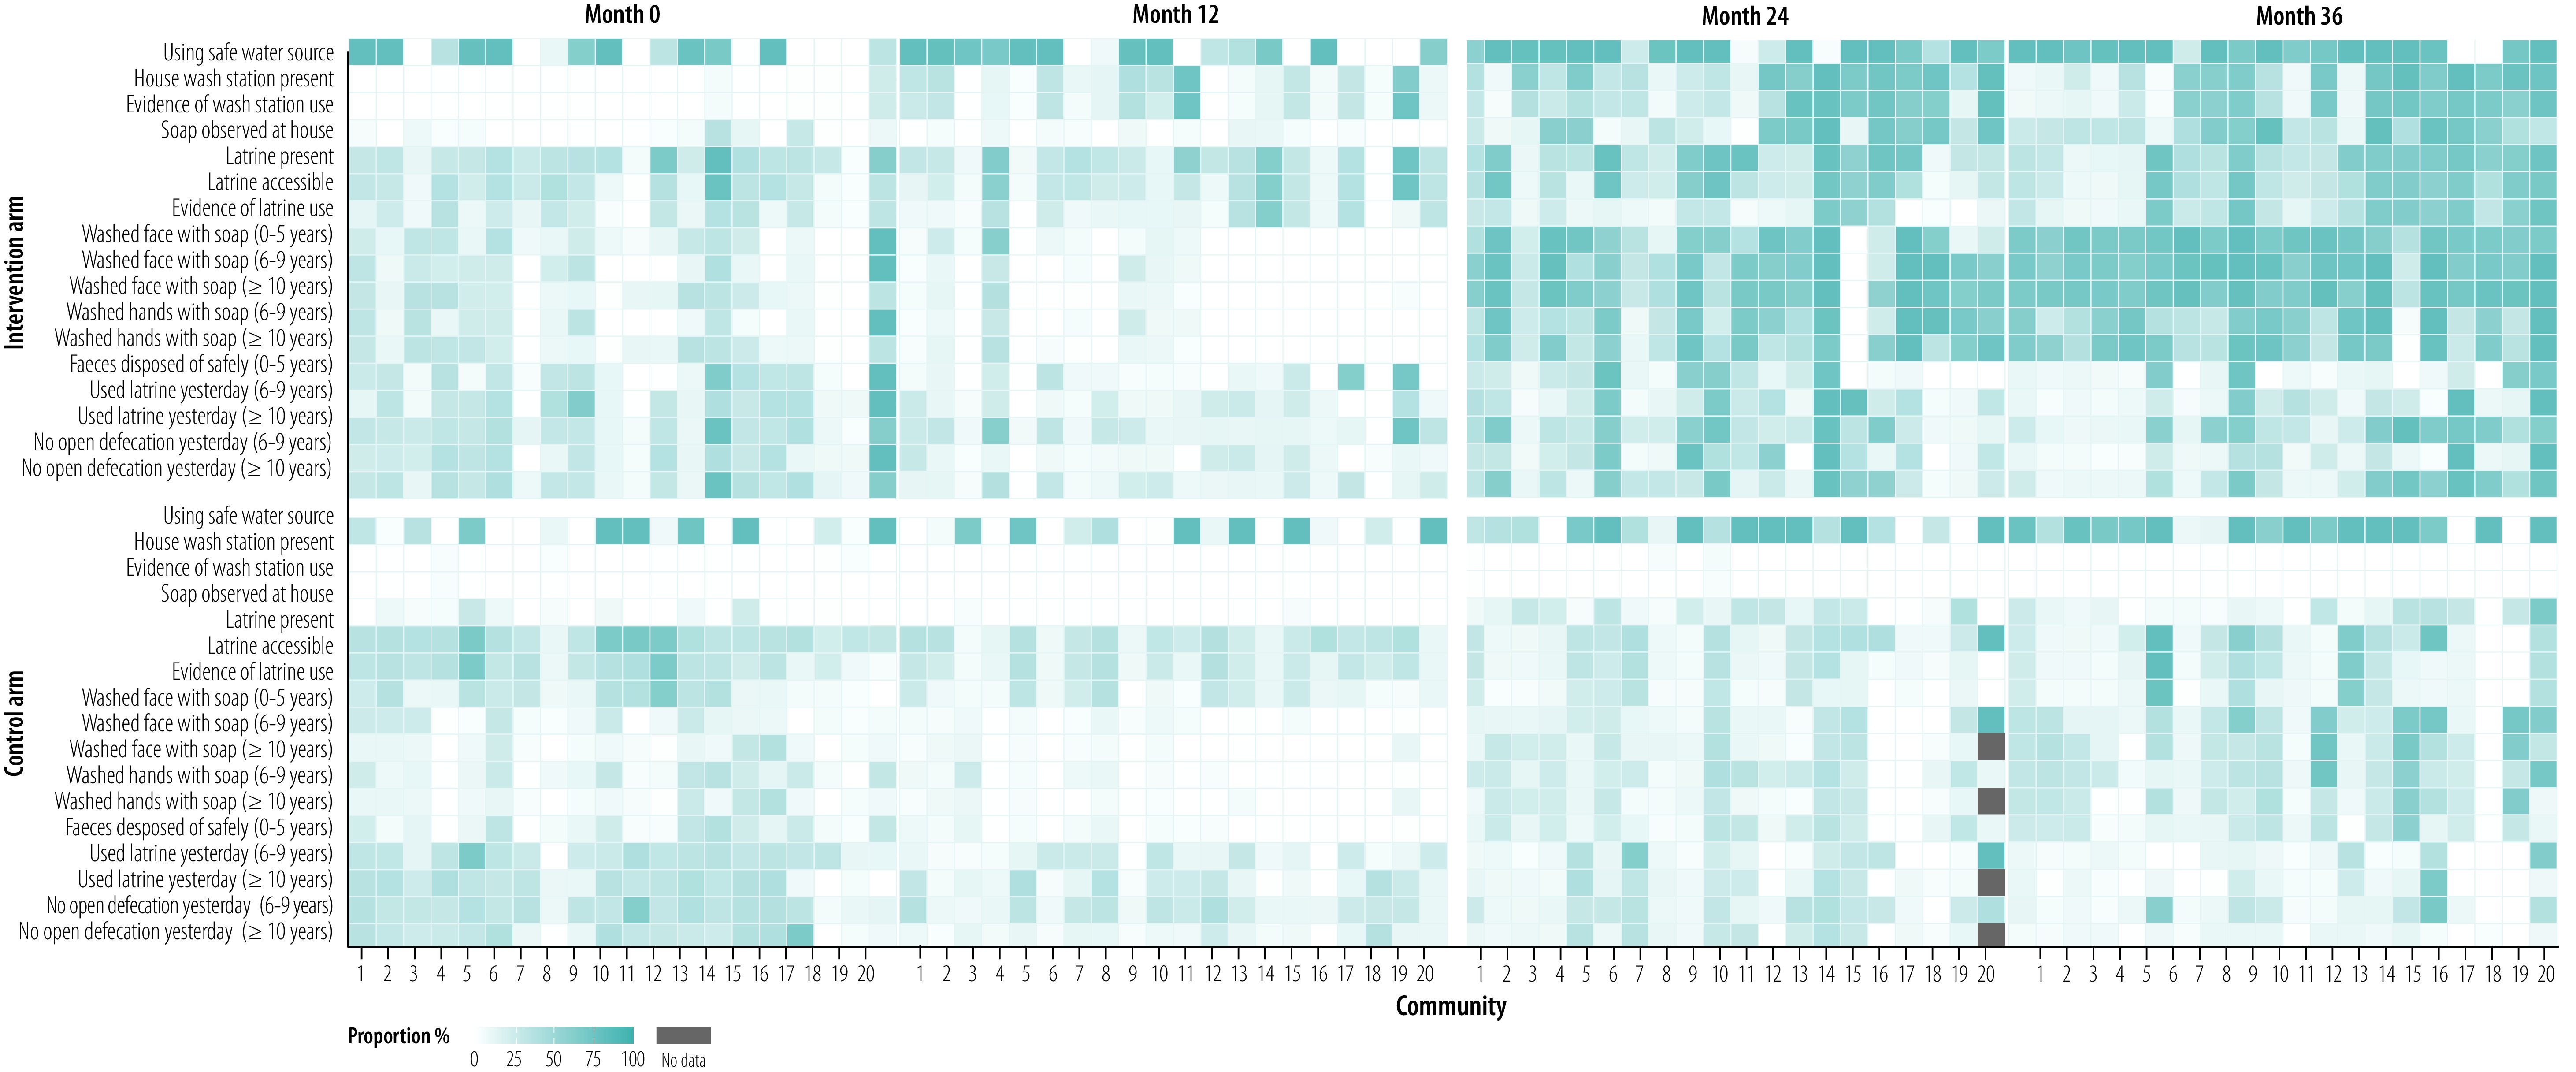
Fig. 2.
Proportion of households per community fulfilling selected water, sanitation and hygiene indicators at annual monitoring visits, Ethiopia, 9 November 2015 to 5 March 2019
Notes: The water, sanitation and hygiene interventions were rolled out in 20 communities (top panels), mostly between baseline (i.e. month 0) and month 12. No specific interventions were implemented in the control arm (bottom panels) during the study period. Each box shows the percentage of households or people per community with a positive response, with darker blue indicating higher levels. Numerators and denominators for each percentage are available in the data repository.25

