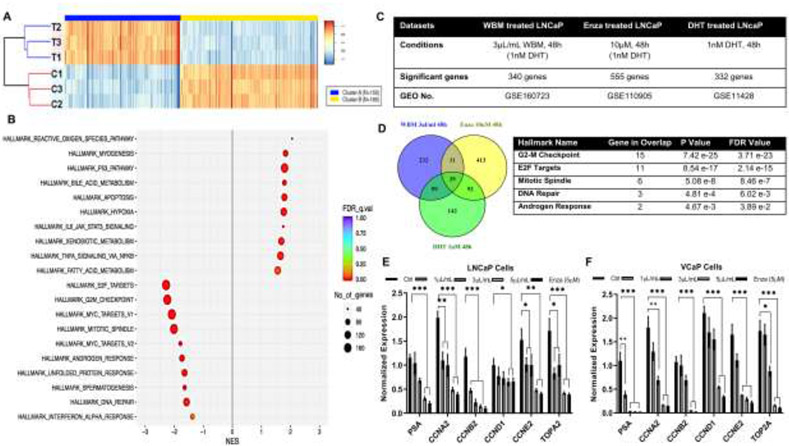
Figure 3. WBM extract suppresses the expression of AR responsive genes.
LNCaP cells were treated with 1 nM DHT, with or without 6X mushroom extract (3 μL/mL), for 48h. Total RNA was sequenced. A) Significant regulated genes between Ctrl (1 nM DHT, 3 samples) versus Treatment (1 nM DHT and WBM extract, 3 samples) were demonstrated by a heat map. There were 155 up-regulated genes (Cluster A, Fold-change ≥ 2, p<0.05) versus 185 down-regulated genes (Cluster B, Fold-change ≤ 0.5, p<0.05). B) Identification of pathways was analyzed by Gene Set Enrichment Analysis (GSEA) with hallmarks of datasets. False discovery rate (FDR) was <0.01, Number of significant genes (NES) >40. C) Three RNA-Seq datasets derived from LNCaP cells with treatments of mushroom extract (3 μL/mL WBM with 1 nM DHT, 48h), enzalutamide (10 μM Enza with 1 nM DHT, 48h,) and DHT (1 nM DHT, 48h) were applied to enrich AR responsive genes. D) Venn Diagram Analysis demonstrated the distribution of the number of genes in three datasets. There were 39 common genes among 3 datasets. Top 5 GSEA-Hallmarks of 39 genes (p<0.05, FDR<0.25). Key Genes involved in Top5 hallmarks were quantified by qRT-PCR in LNCaP E) and VCaP F) cells.

