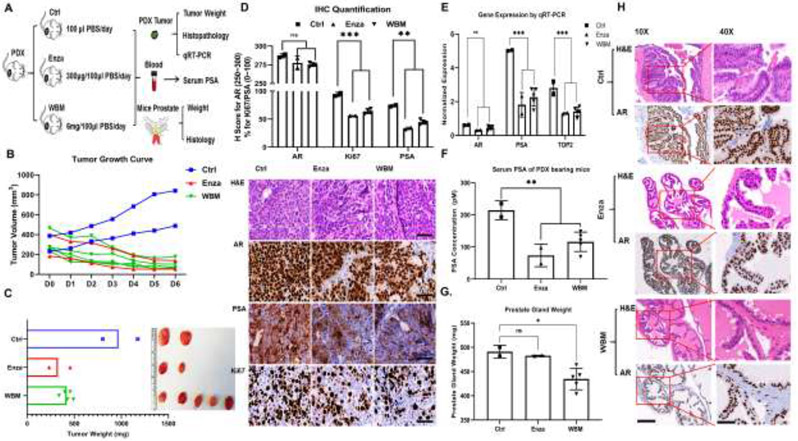
Figure 5. Intake of WBM extract suppresses PDX tumor growth and PSA expression.
A) Male 6~8-week-old NSG mice bearing PCa PDX fragments were gavaged with WBM extract (6 mg/mice/day, 5 mice in WBM group), enzalutamide (300 μg/mice/day, 2 mice in Enza group) or PBS (2 mice in Ctrl group) for 6 days. B) The tumor volume in mm3 is represented by individual values in each group by different colors. C) Tumor xenografts in each group are illustrated and tumor weights are represented by individual values in each group by different colors. D) Hematoxylin and eosin (H&E) and immunohistochemistry (IHC) staining of AR, PSA, and Ki67 on formalin-fixed tumor tissues in each group. The IHC staining was scored (upper panel) by the QuPath software (version 0.2). Immunoreactivity of AR was reported as H score (upper left panel). Ki67 and PSA were reported by their percentage of positive cells (upper right panels). Scale bar of representative images is 40X by 100 μm. E) The mRNA level of AR, PSA, and TOP2 in tumor fragments of each group was quantified by qRT-PCR. F) The PSA concentrations in serum were detected by PSA (human) ELISA kit. G) The prostate gland weight in each group is presented as a median±standard error for the mean. H) Hematoxylin and eosin (H&E) and immunohistochemistry (IHC) of AR staining on the formalin-fixed prostate gland in each group. The AR-positive complex acini in anterior prostate gland are shown. Scale bar for 10X and 40X, with scale bar of 400 μm and 100 μm, respectively. p values were determined by multiple Student's t-tests. *p<0.05, **p<0.01, ***p<0.001. ns. No significant difference.

