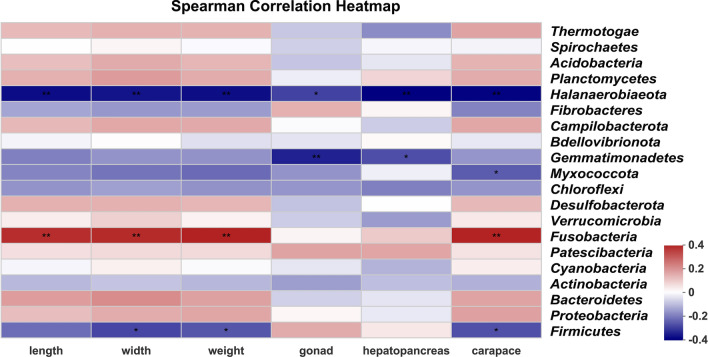
Fig. 4.
Spearman correlation heatmap showing the correlation between 20 dominant phyla and body parameters of sampled crabs. Length, width, and weight represent the body length, width, and weight of crabs; carapace, gonad, and hepatopancreas represent the wet weight of the carapace, gonad, and hepatopancreas. Firmicutes, the most dominant phylum, was negatively correlated with body width and weight of sampled crabs. Positive correlations are shown in red and negative correlations are shown in blue. * P < 0.05; ** P < 0.01

