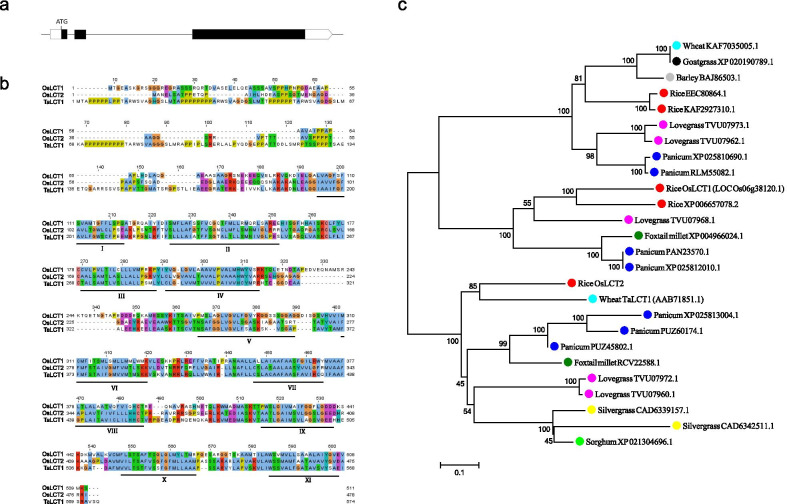
Fig. 1.
Gene structure of OsLCT2 and phylogenic relationships of LCT proteins. a Schematic diagram of OsLCT2 gene structure. UTRs, exons, and introns are indicated by blank rectangles, black rectangles, and black lines, respectively. b Alignment of the predicted amino acid sequences of OsLCT1, OsLCT2 and TaLCT1. Identical or similar amino acids are indicated by the same background color. Non-conservative amino acids are indicated by different background colors. The predicted trans-membrane domains are underlined and labeled by Roman numerals. c Phylogenic tree of LCT-like proteins. The predicted LCT amino acid sequences were used to construct the phylogenetic tree using MEGA7. Unidentified proteins are represented by accession numbers in the NCBI database. The scale bar of 0.1 is equal to 10% sequence divergence

