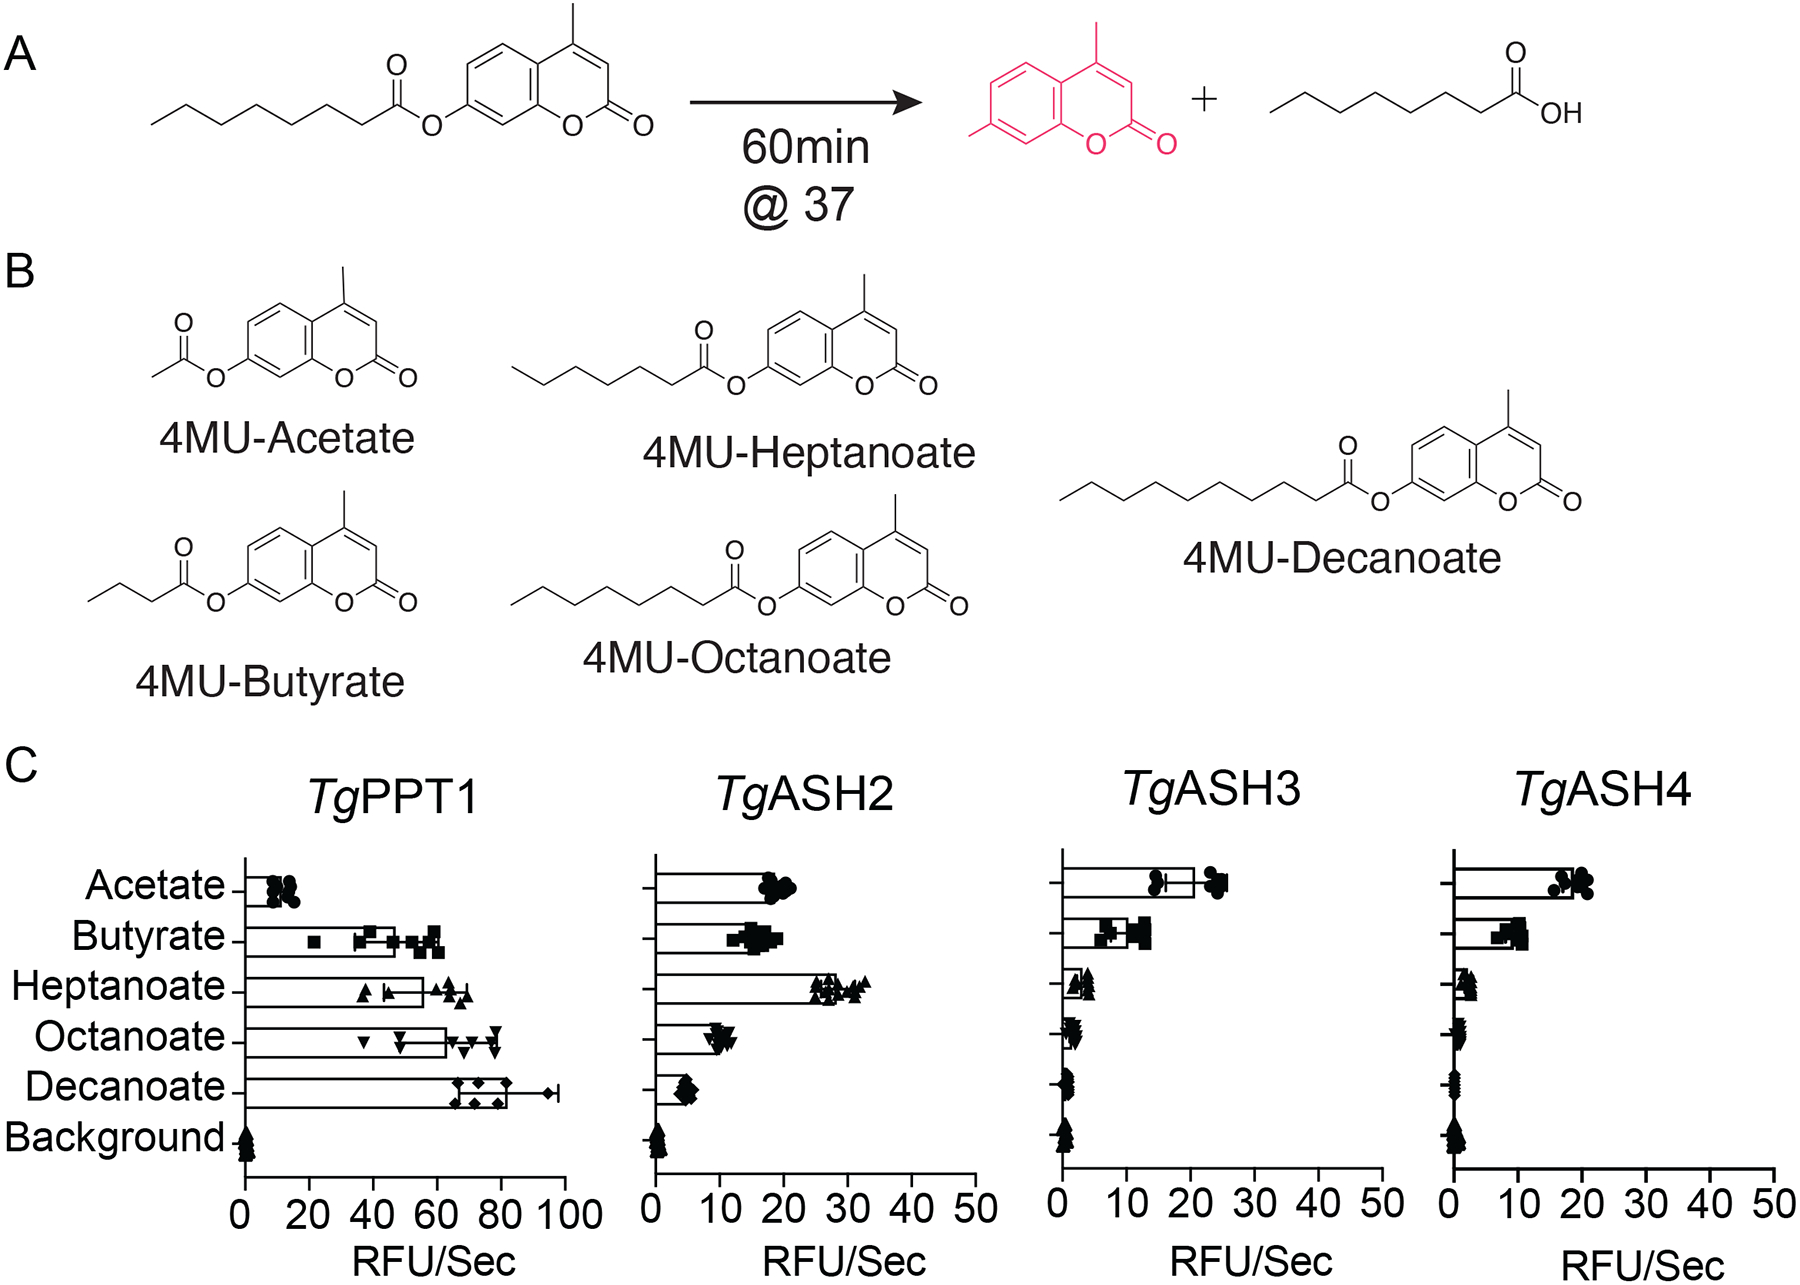
Figure 3. Substrate specificity of TgASH enzymes.

(A) General reaction scheme for enzymatic hydrolysis of 4-methylumbelliferone (4MU) substrates. (B) Chemical structures of 4MU substrates with varying lipid chain lengths. (C) Substrate specificity profiles for TgPPT1 and TgASH2–4 enzymes suing the 4MU substrates. Plots show average turnover rates for each recombinant enzyme as relative fluorescent units. Velocities for each substrate are depicted as relative fluorescence units/sec (λex = 365 nm, λem = 455 nm). Values are the means of triplicates ± standard error.
