
Figure 2. Eosinophil Aiolos deficiency results in impaired homeostatic eosinophil accumulation.
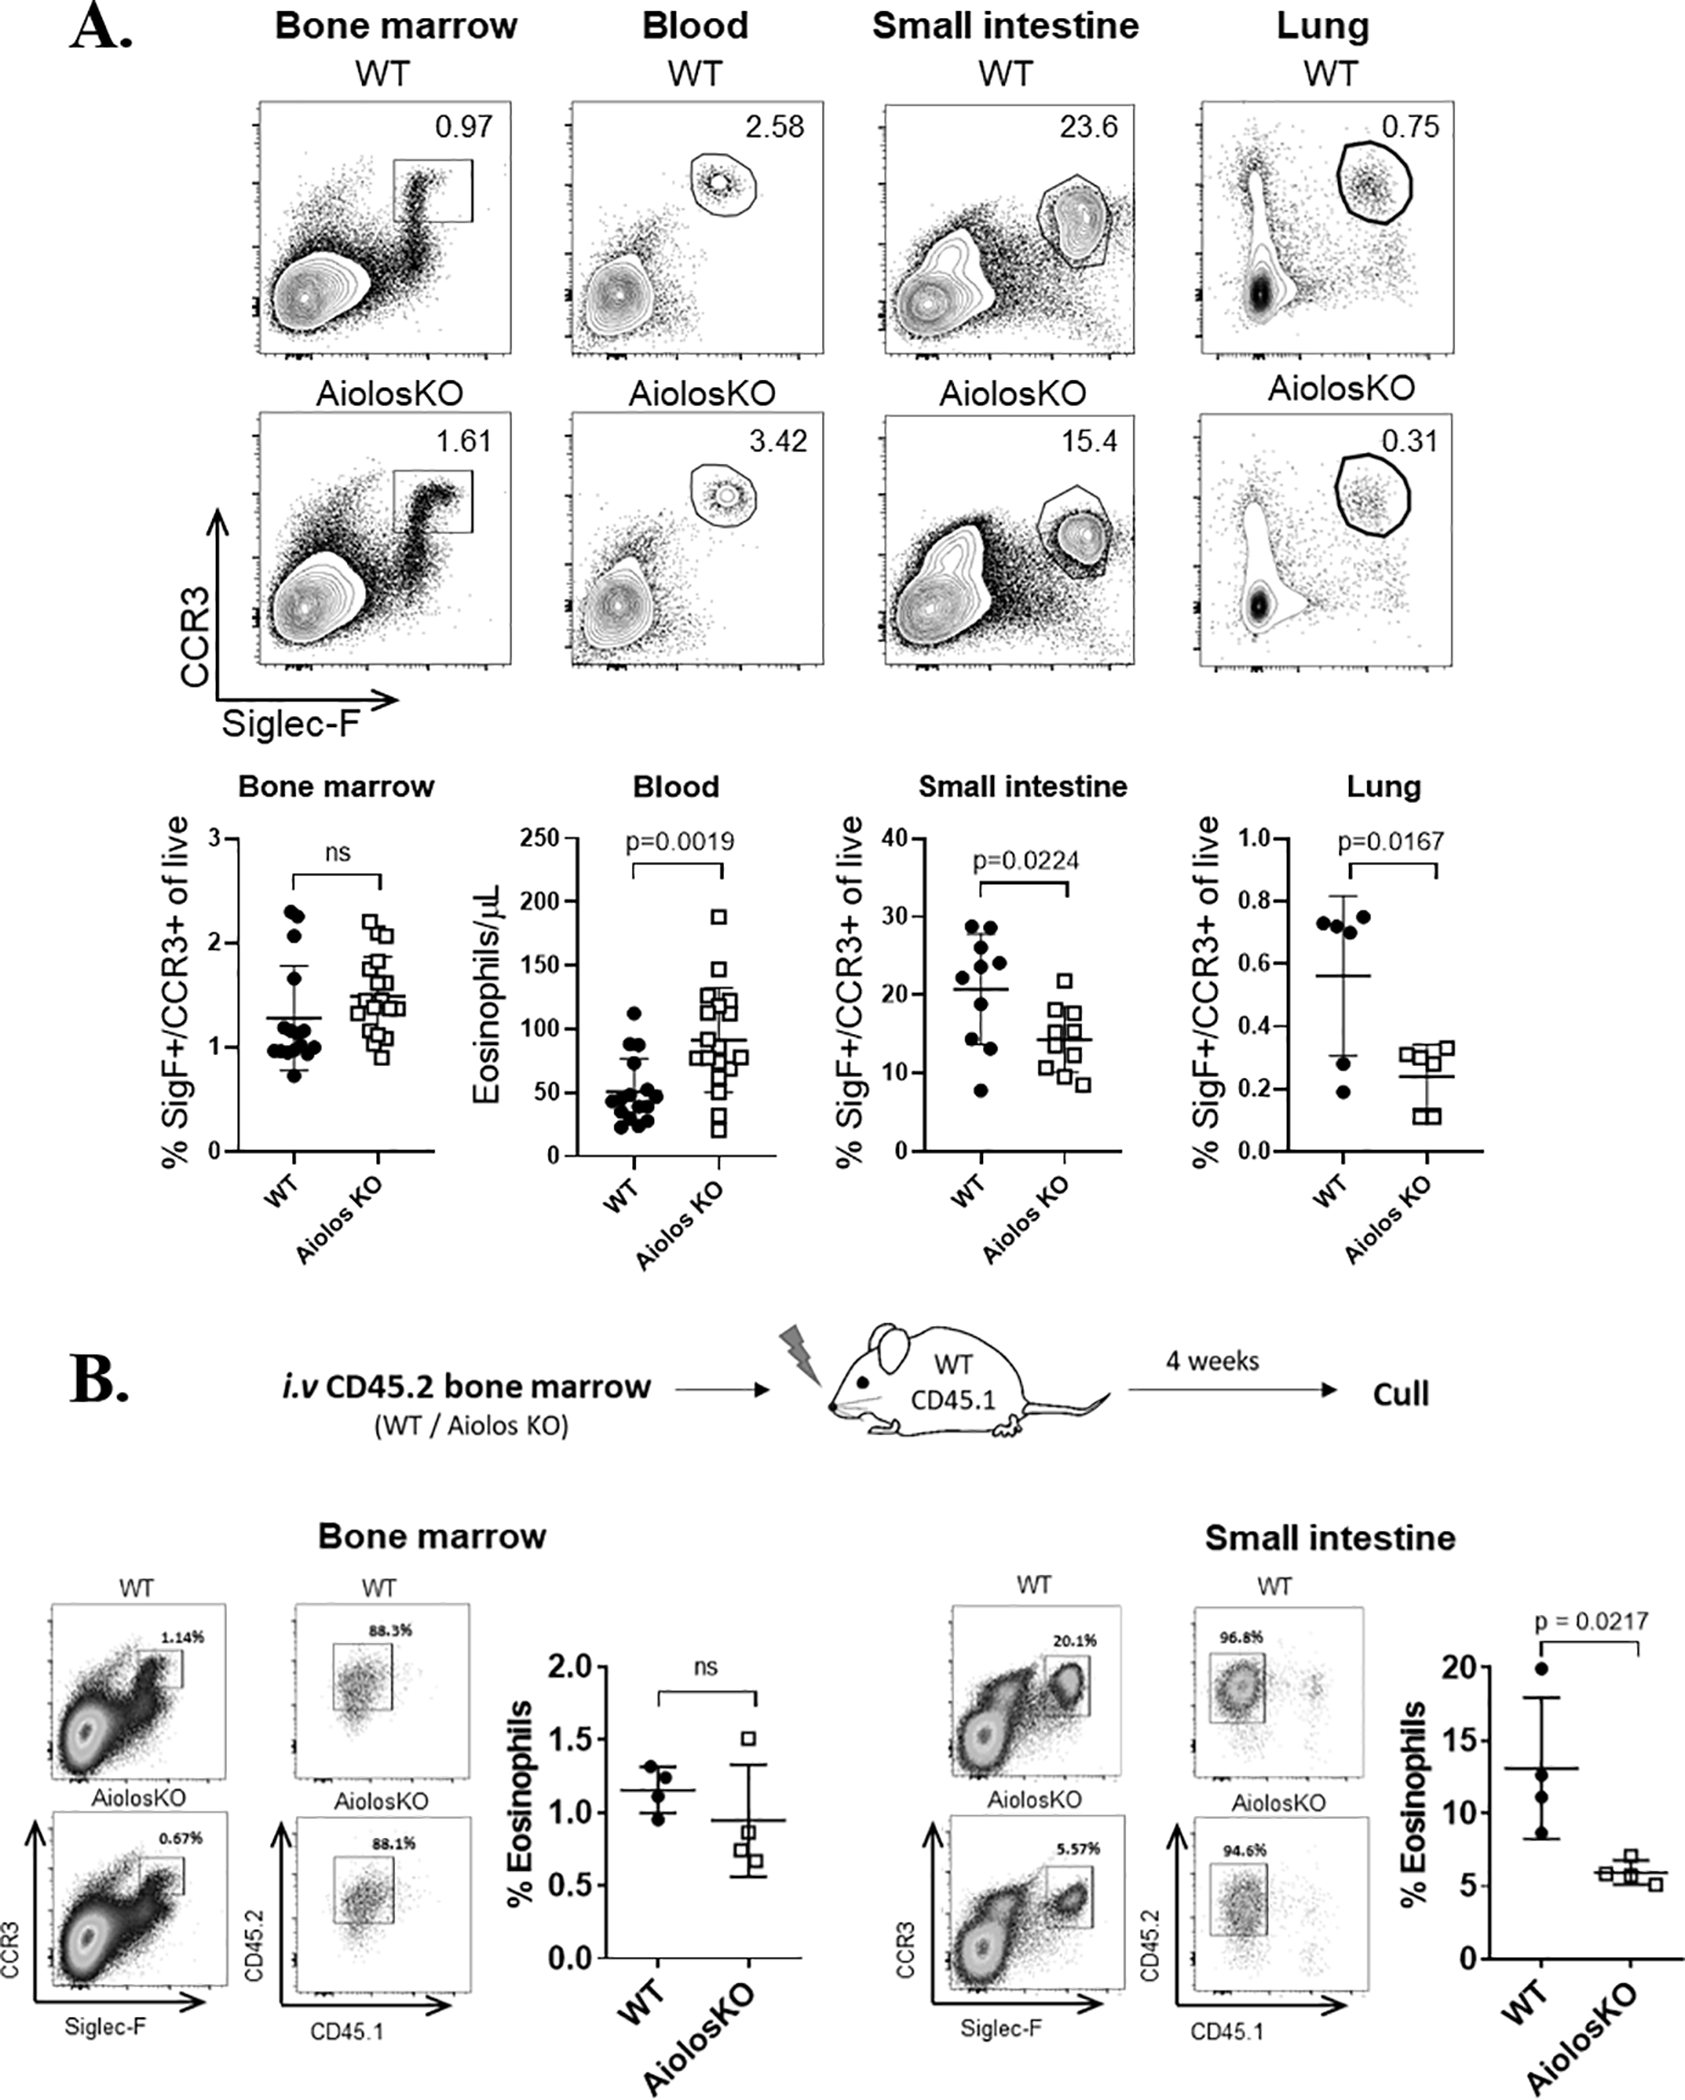
(A) Representative flow plots with frequency (mean ± SEM) of eosinophils in the bone marrow (n = 16–18 mice/group, >5 independent experiments), blood (n = 16–18 mice/group, >5 independent experiments), small intestine (n = 10 mice/group, 3 independent experiments), and lung (n = 6 mice/group, 2 independent experiments) of wildtype (WT) or Aiolos-deficient (Aiolos KO) mice are shown. (B) Experimental schema (top) for adoptive transfer of CD24.2 WT or Aiolos KO whole bone marrow cells into irradiated CD45.1 recipient mice. Representative contour plots showing mature eosinophils in the bone marrow (left) and small intestine (right) of CD45.1+ WT mice 4 weeks after transplantation with WT (CD45.2+) or Aiolos KO (CD45.2+) bone marrow are shown. Percentage of live, Siglec-F+[SigF+]CCR3+ and CD45.2+ cells from the donor bone marrow is shown in upper right. Bar charts showing frequency (mean ± SEM) of donor eosinophils in the bone marrow and small intestine of the recipient mice (n = 4 mice/ group, 3 independent experiments) are shown. ns, not significant; SigF+, Siglec-F+