
Figure 3. CCR3 signaling activity is reduced in Aiolos-deficient eosinophils.
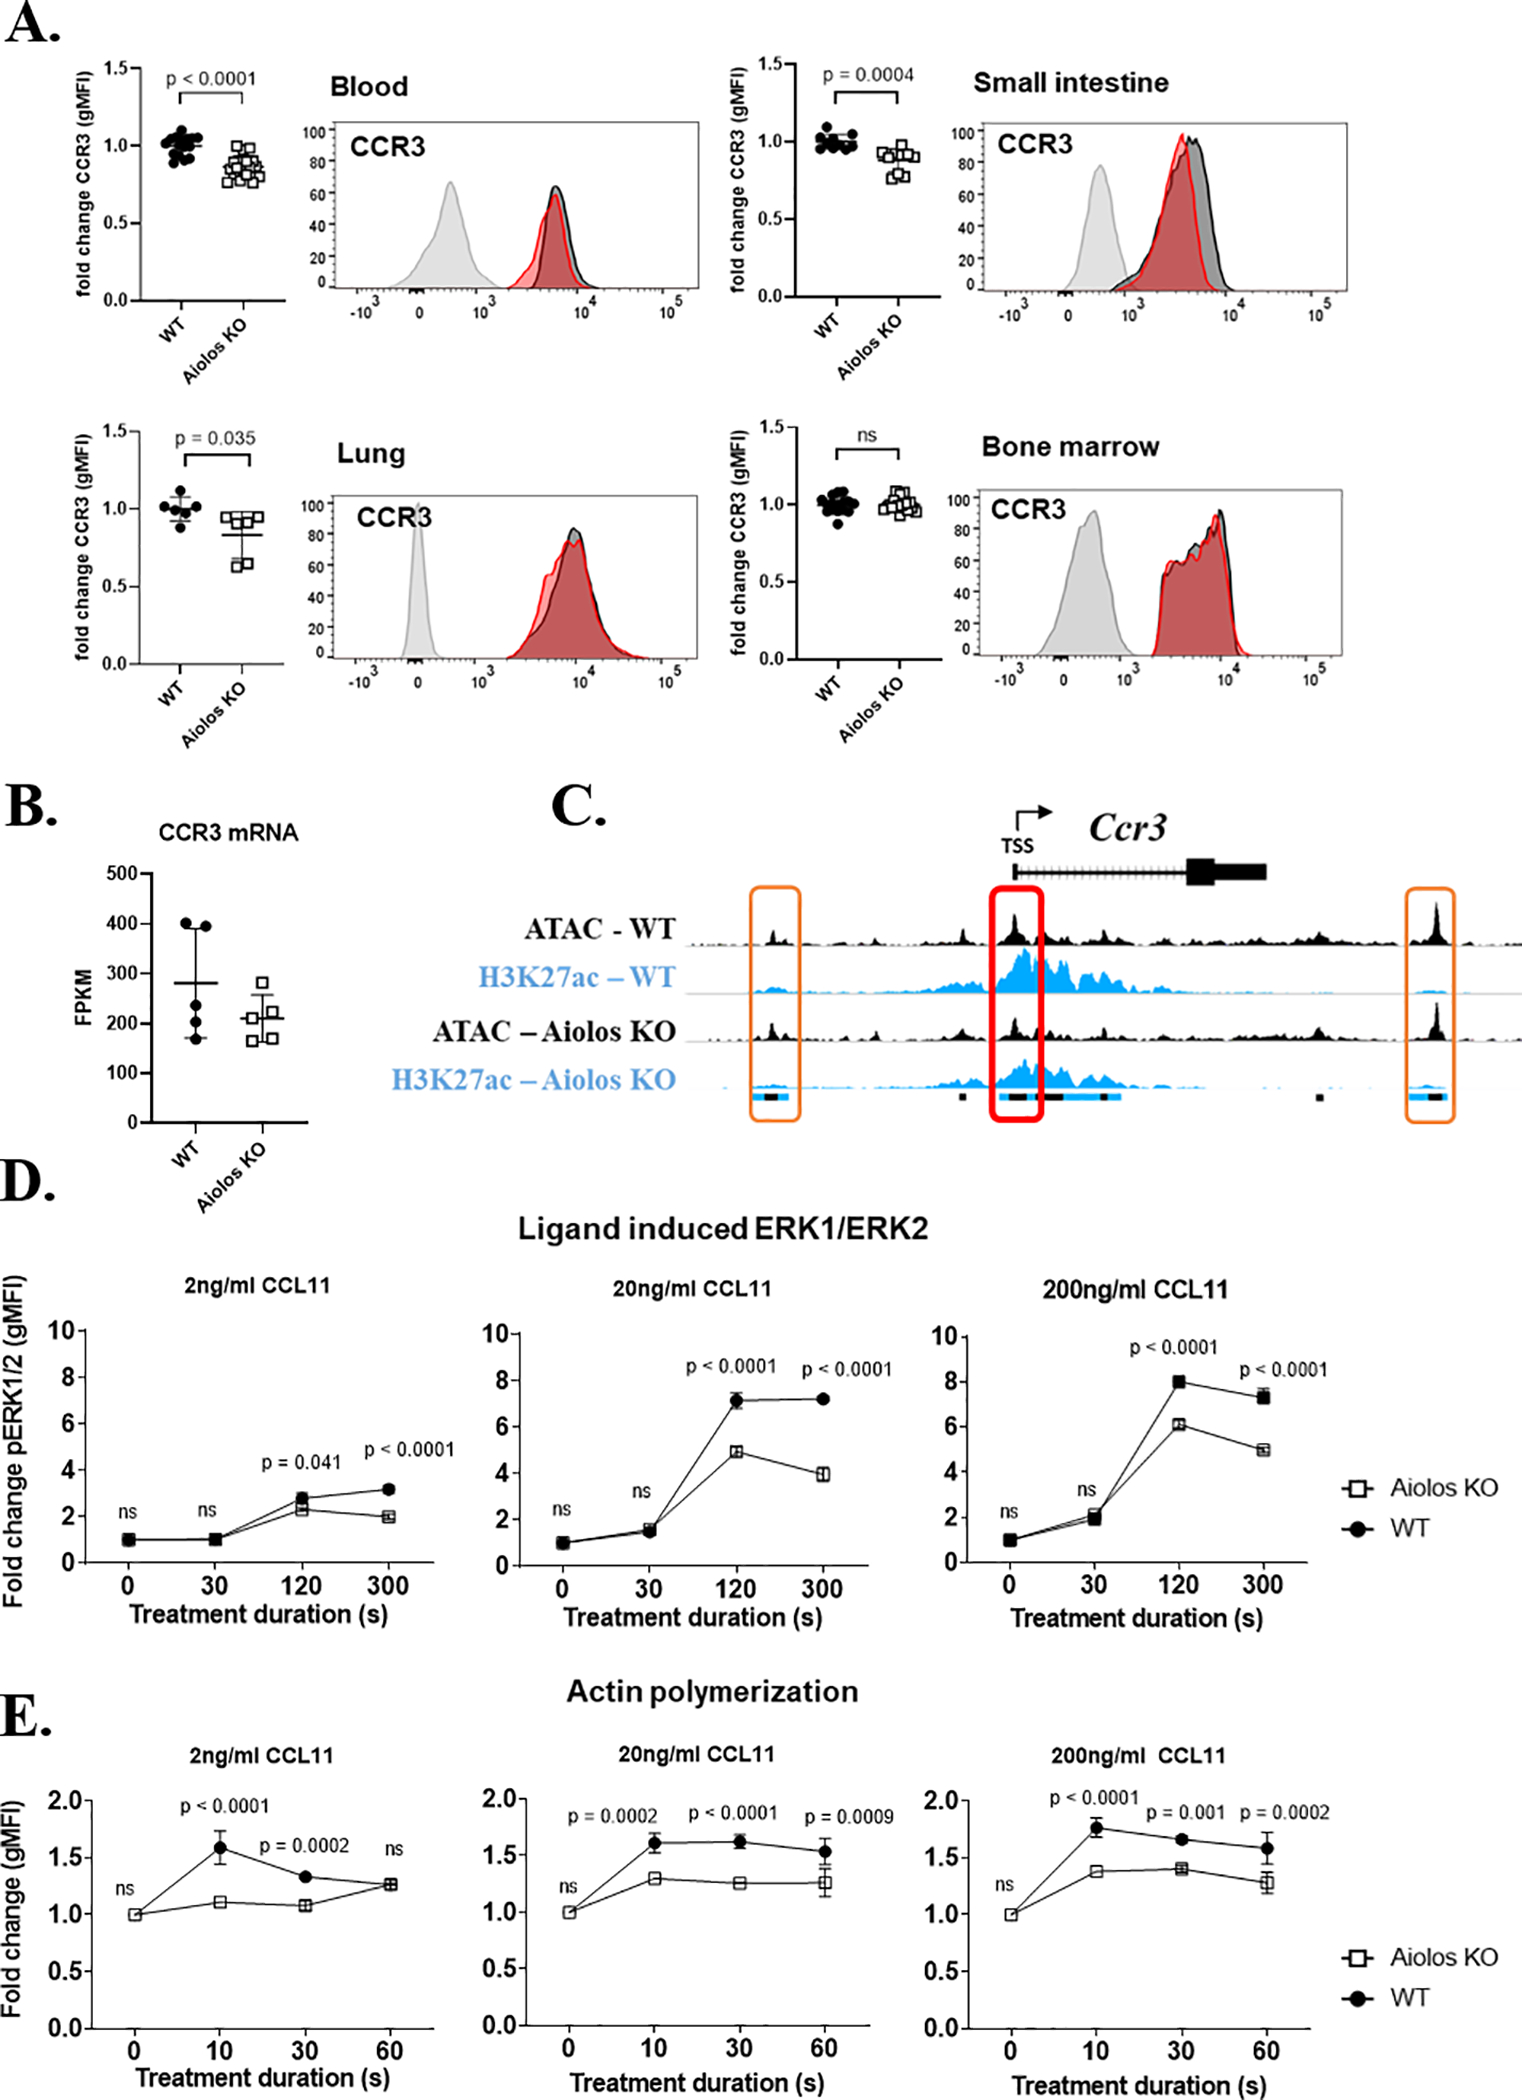
(A) CCR3 surface expression, with representative histograms, (geometric mean of fluorescence intensity, mean ± SEM) on wildtype (WT, black circles) and Aiolos-deficient (Aiolos KO, white squares) eosinophils in the bone marrow (n = 16–18 mice/group, >5 independent experiments), blood (n = 16–18 mice/group, >5 independent experiments), small intestine (n = 10 mice/group, 3 independent experiments), and lung (n = 6 mice/group, 2 independent experiments) during homeostasis is shown. (B) CCR3 mRNA gene expression between genotypes n = 5/group, 3 independent experiments. (C) Chromatin landscape schema for open (ATAC marked) and active (H3K27ac marked) regions within 20 kB of the murine Ccr3 gene. The red box (middle) identifies an eosinophil promoter located within 1 kB of the transcriptional start site (TSS) of CCR3. The orange boxes (left and right) identify active enhancers identified within 20 kB of CCR3. The colored boxes below the alignment tracks identify shared regulatory elements between genotypes for each chromatin modification; ATAC (black), H3K27ac (blue). The fold change (mean ± SEM) in (D) phosphorylated ERK1/2 (pERK1/2) and (E) actin polymerization in WT (black circles) or Aiolos KO (white squares) eosinophils stimulated with three doses of CCL11 (2 ng/mL, 20 ng/mL and 200 ng/mL) (n = 3 mice/group, 3 independent experiments).