
Figure 3.
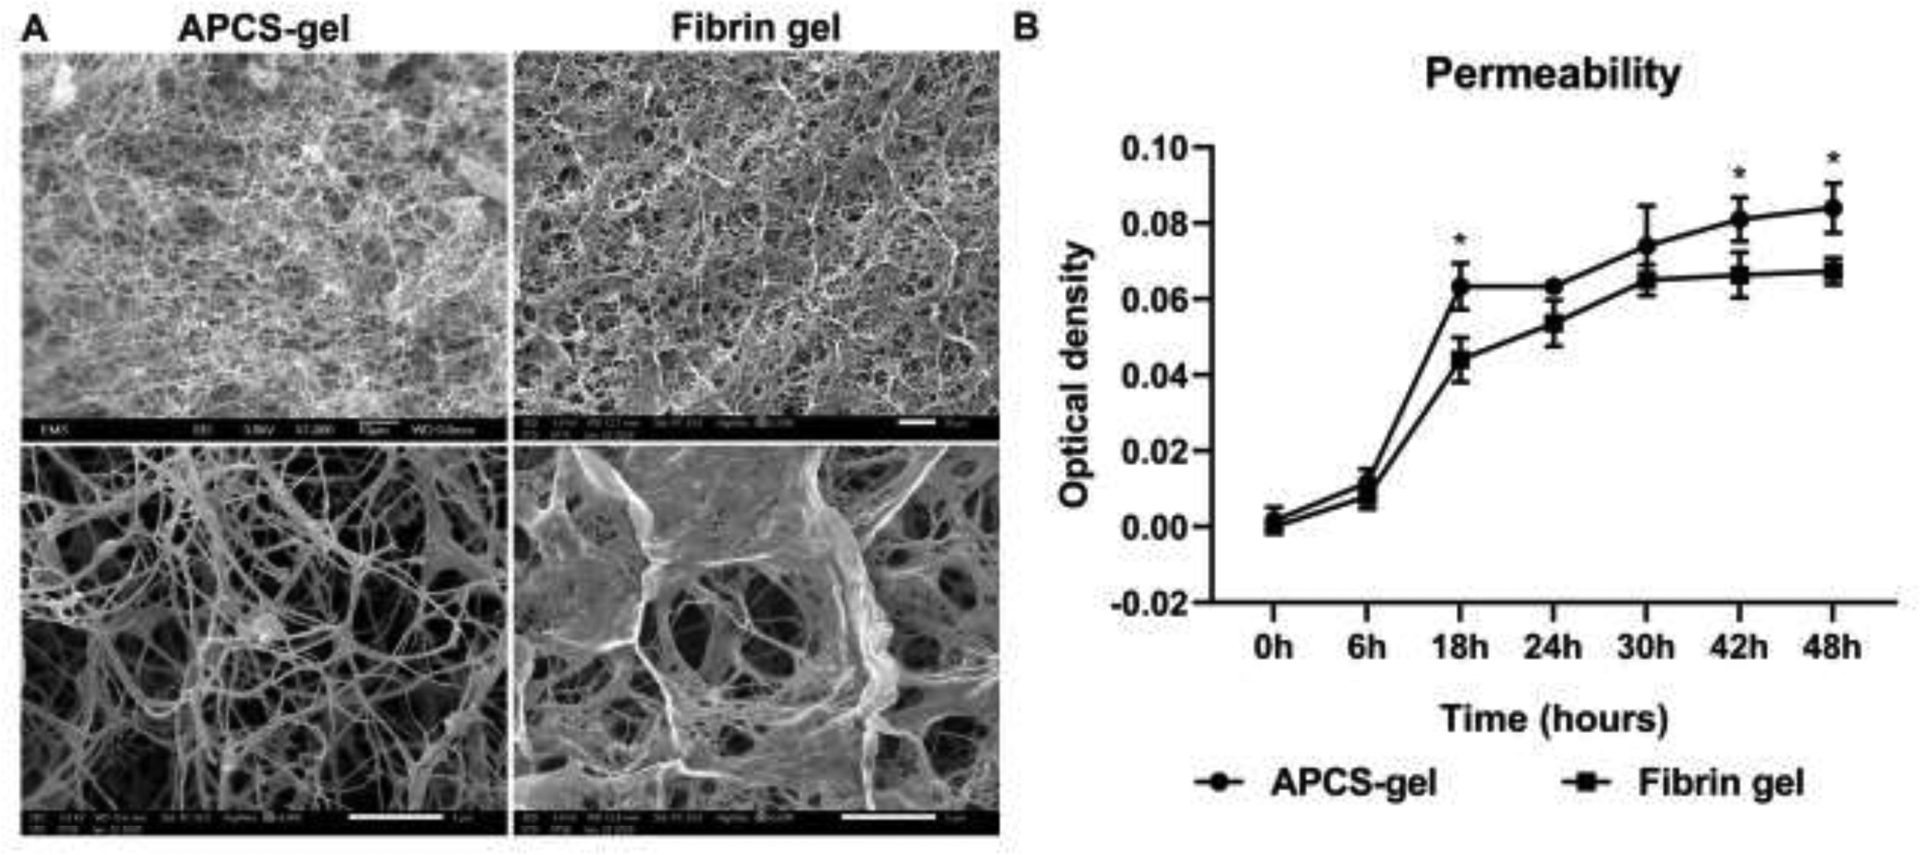
Scanning electron microscopy micrographs and the permeability assessment of APCS-gel and fibrin gel. The SEM micrograph (A) showed 1000 × (upper) and 5000 × images (lower) of APCS-gel (20 mg/ml APCS group) or fibrin gel respectively. The ultrastructure of APCS-gel demonstrated higher porosity (63 ± 5%) than the fibrin gel (28 ± 4%) (p<0.05; n=3). (B) The permeability assay showed that the APCS-gel had significantly higher permeability than the fibrin gel during 48 hours of observation (p< 0.05; n=3). Scale bars represent 10 μm (1000 ×) and 5 μm (5000 ×)