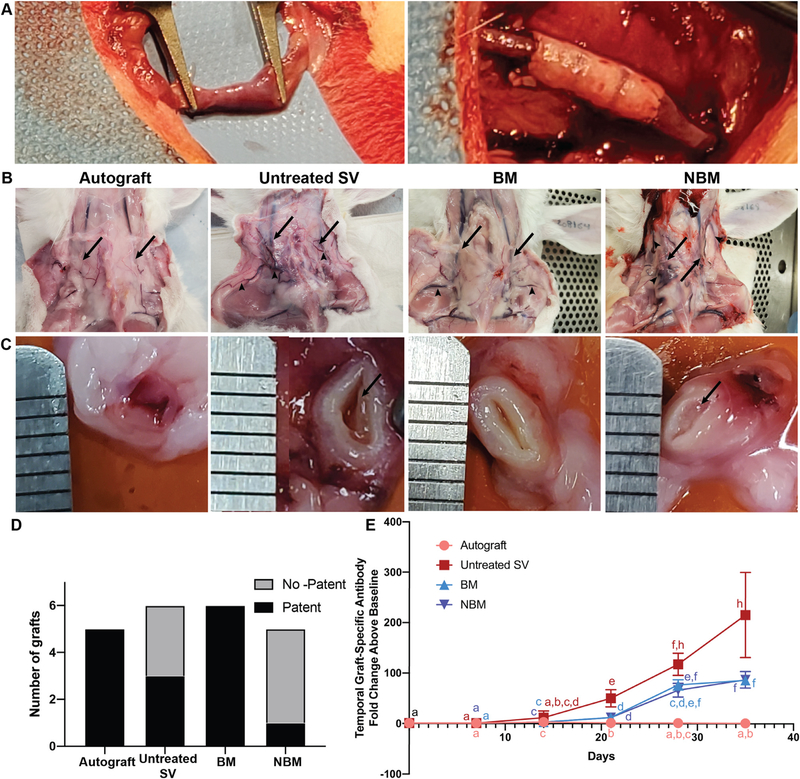
Fig. 5.
Gross pathology of in vivo jugular interposition grafts and associated humoral adaptive immune response. (A) Representative intraoperative surgical images of the jugular vein (left) and interposition graft (right) immediately after implantation. (B) Representative images of the interposition sites immediately before explantation (day 35), showing the graft location (arrows) and development of collateral vessels (arrow heads). (C) Representative cross-sectional image of the graft lumen in the mid-graft region for each group (ruler marks = 1 mm). Organized pre-mortem intraluminal thrombus is evident in the untreated SV and non-basement membrane groups (arrows), whereas the allograft and basement membrane groups have no evidence of thrombus formation. (D) Scaffolds in the Autograft and BM groups resulted in high patency rates, whereas untreated SV scaffolds and NBM scaffolds resulted in low patency rates. (E) Graft specific antibody production towards all bovine scaffolds is first significantly different from autograft on day 21. Antibody production towards AR-scaffolds starts to plateau by day 28, while the antibody production towards untreated SV scaffolds continues to increase. Both AR groups stimulate significantly less graft-specific antibody production than that toward untreated SV scaffolds by day 35. Groups not connected by lower case letters are statistically different. Repeated measures two-way ANOVA and Tukey-Kramer HSD post-hoc analyses on standard least squares means.

