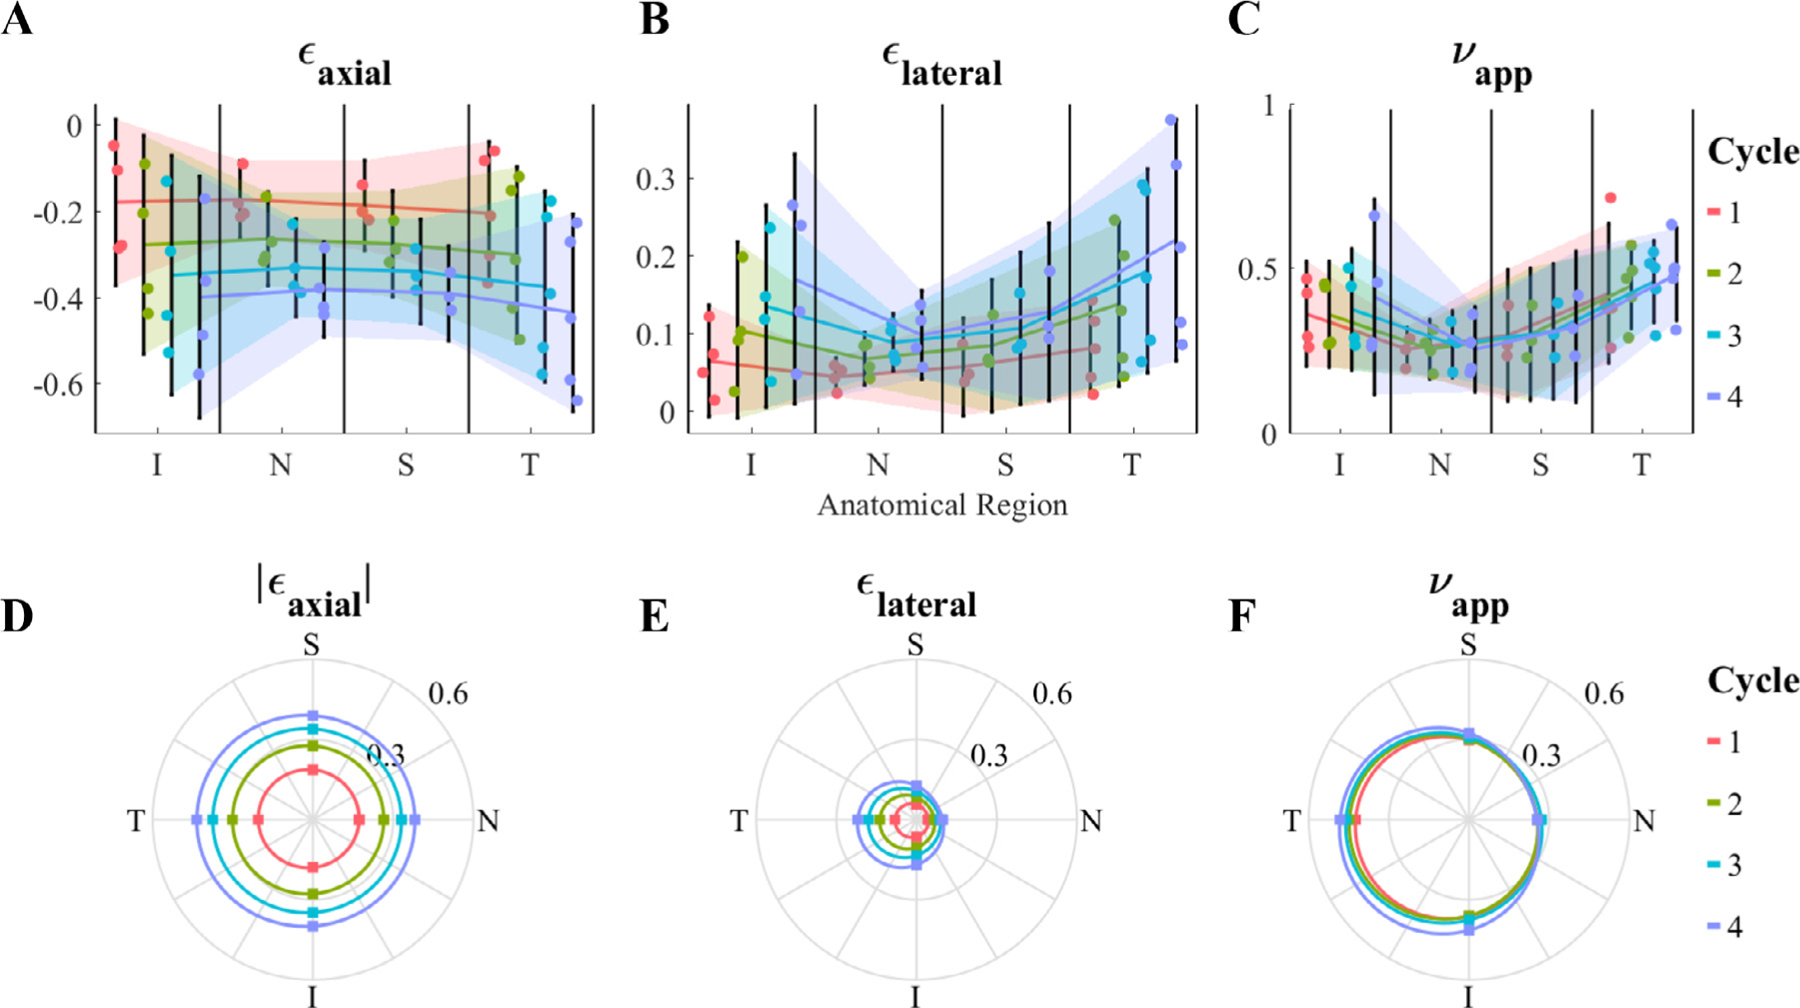
Fig. 2.

Regional dependence (analysis of variance) of (A and D) axial strain [ϵaxial], (B and E) lateral strain [ϵlateral], and (C and F) apparent Poisson’s ratio [νapp]. For each parameter, the first row (A-C) shows the individual data points, their means, and 95% confidence intervals (shaded region) for each anatomical region and cycle number, and the second row (D F) illustrates the mean values (dots) in a polar plot matching the anatomical orientations, where 0, 90, 180 and 270° correspond to nasal [N], superior [S], temporal [T], and inferior [I], respectively. Although there was no significant effect of anatomical region on ϵaxial, both ϵlateral and νapp were affected by the anatomical region, with the temporal and inferior quadrants having larger values compared to the nasal and superior quadrants. The cycle number significantly impacted ϵaxial and ϵlateral; however, it did not affect νapp. There was no interaction effect between the anatomical region and cycle number, i.e. heterogeneity was not affected by loading level.
