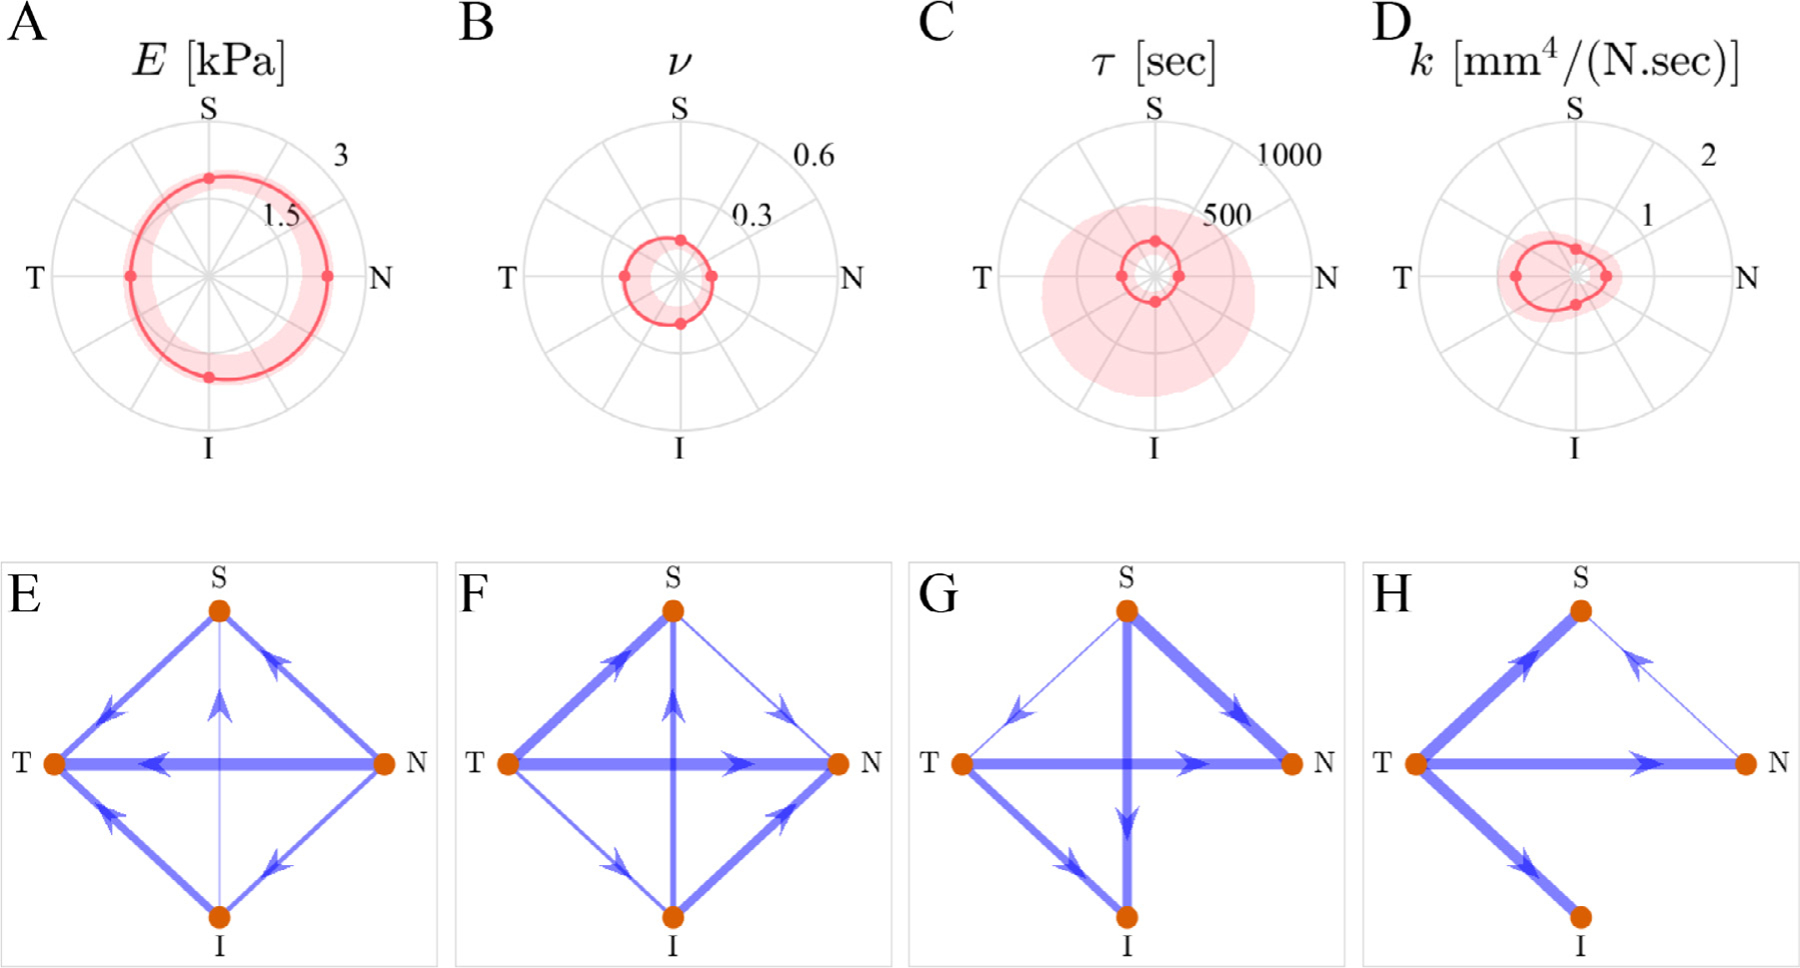
Fig. 5.

Anatomical distribution of the fit results. The first row shows the spatial distribution of each fitting parameter. The dots correspond to the median values, solid lines are the interpolated medians, and shaded areas are 95% confidence intervals for the acceptable fits (not the inter-sample variance). The second row shows the results of the multiple comparisons between the parameter values for each anatomical region using network graphs, where every arrow connecting two regions (start and destination) indicate that the “start” region has a statistically-significantly larger value compared to the “destination,” and the width of the lines is linearly proportional to the magnitude of the difference. The absence of a line implies that the difference was not statistically significant.”
