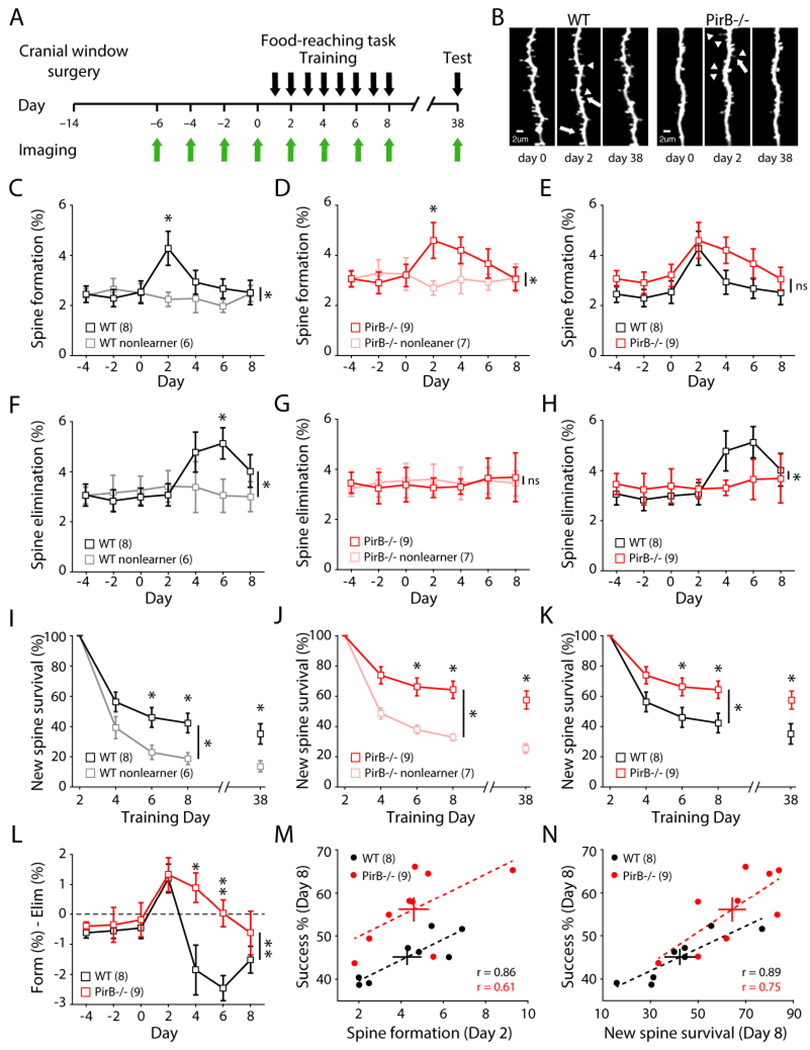
Figure 2. More Stability of Newly Formed Spines During Early Learning in PirB−/− Mice Correlates with Learning Performance.

(A) Experimental timeline.
(B) Representative dendrites repeatedly imaged throughout training. Arrows: elimination, arrow heads: formation.
(C) Increased spine formation rates in WT learners during early training (day 0: 2.54 ± 0.45%; day 2: 4.28 ± 0.68%; n = 8; p = 0.016, Wilcoxon), but not in non-learners (day 0: 2.51 ± 0.37%; day 2: 2.26 ± 0.29%; n = 6; p = 0.688, Wilcoxon). Significant difference between learners and non-learners (p = 0.0084, 2-way repeated measures ANOVA).
(D) Increased spine formation rates in PirB−/− learners during early training (day 0: 3.20 ± 0.45%; day 2: 4.60 ± 0.72%; n = 9; p = 0.008, Wilcoxon), but not in non-learners (day 0: 3.26 ± 0.65%; day 2: 2.70 ± 0.28%; n = 7; p = 0.375, Wilcoxon). Significant difference between learners and non-learners (p = 0.0063, 2-way repeated measures ANOVA).
(E) Learning-induced spine formation rates in PirB−/− learners were not significantly different from WT learners (p = 0.228, 2-way repeated measures ANOVA).
(F) Increased spine elimination rates in WT learners during training (day 0: 2.99 ± 0.35%; day 6: 5.13 ± 0.62%; p = 0.008, Wilcoxon), but not in non-learners (day 0: 3.26 ± 0.56%; day 6: 3.05 ± 0.66%; p = 0.438, Wilcoxon). Significant difference between learners and non-learners (p = 0.0144, 2-way repeated measures ANOVA).
(G) No increase in spine elimination rate in PirB−/− learners (day 0: 3.38 ± 0.69%; day 6: 3.65 ± 0.80%; p = 0.734, Wilcoxon) or non-learners (day 0: 3.56 ± 0.69%; day 2: 3.56 ± 0.52%; p = 0.813, Wilcoxon). Spine elimination throughout training was not different between PirB−/− learners and non-learners (p = 0.952, 2-way repeated measures ANOVA).
(H) Impaired learning-induced spine elimination rates in PirB−/− learners (p = 0.035, 2-way repeated measures ANOVA).
(I) Survival of learning-induced spines (formed on day 2). Learning stabilized new spines in WT learners compared to non-learners (p = 0.0283, 2-way repeated measures ANOVA). Difference persisted 30 days later (WT learners: 35.143 ± 6.735%; WT non-learners: 13.667 ± 3.685%; p = 0.0221, Mann-Whitney).
(J) Learning stabilized newly formed spines in PirB−/− mice (p = 0.001, 2-way repeated measures ANOVA). Difference persisted 30 days later (PirB−/− learners: 57.556 ± 6.005%; PirB−/− non-learners: 25.333 ± 2.894%; p = 0.0028, Mann-Whitney).
(K) PirB−/− learners have increased survival of learning-induced spines relative to WT learners (p = 0.0333, 2-way repeated measures ANOVA). This difference persisted even after 30 days (p = 0.033, Mann-Whitney).
(L) Net dendritic spine dynamics were significantly different between WT and PirB−/− mice (p = 0.007, 2-way repeated measures ANOVA).
(M) Correlation between early learning spine formation rates and last day performance on reaching task (WT: r = 0.8637; p = 0.0057, Pearson correlation; PirB−/−: r = 0.6071; p = 0.0830, Pearson correlation).
(N) Correlation between survival of learning-induced spines and last day performance on reaching task (WT: r = 0.8900; p = 0.0031, Pearson correlation; PirB−/−: r = 0.7455; p = 0.0211, Pearson correlation).
(C-L) Squares depict mean (± s.e.m.).
(M, N) Circles depict individual animals, crosses depict mean ± s.e.m., dotted lines depict linear fit of each correlation.
* p < 0.05, ** p < 0.01; ns: non-significant.
