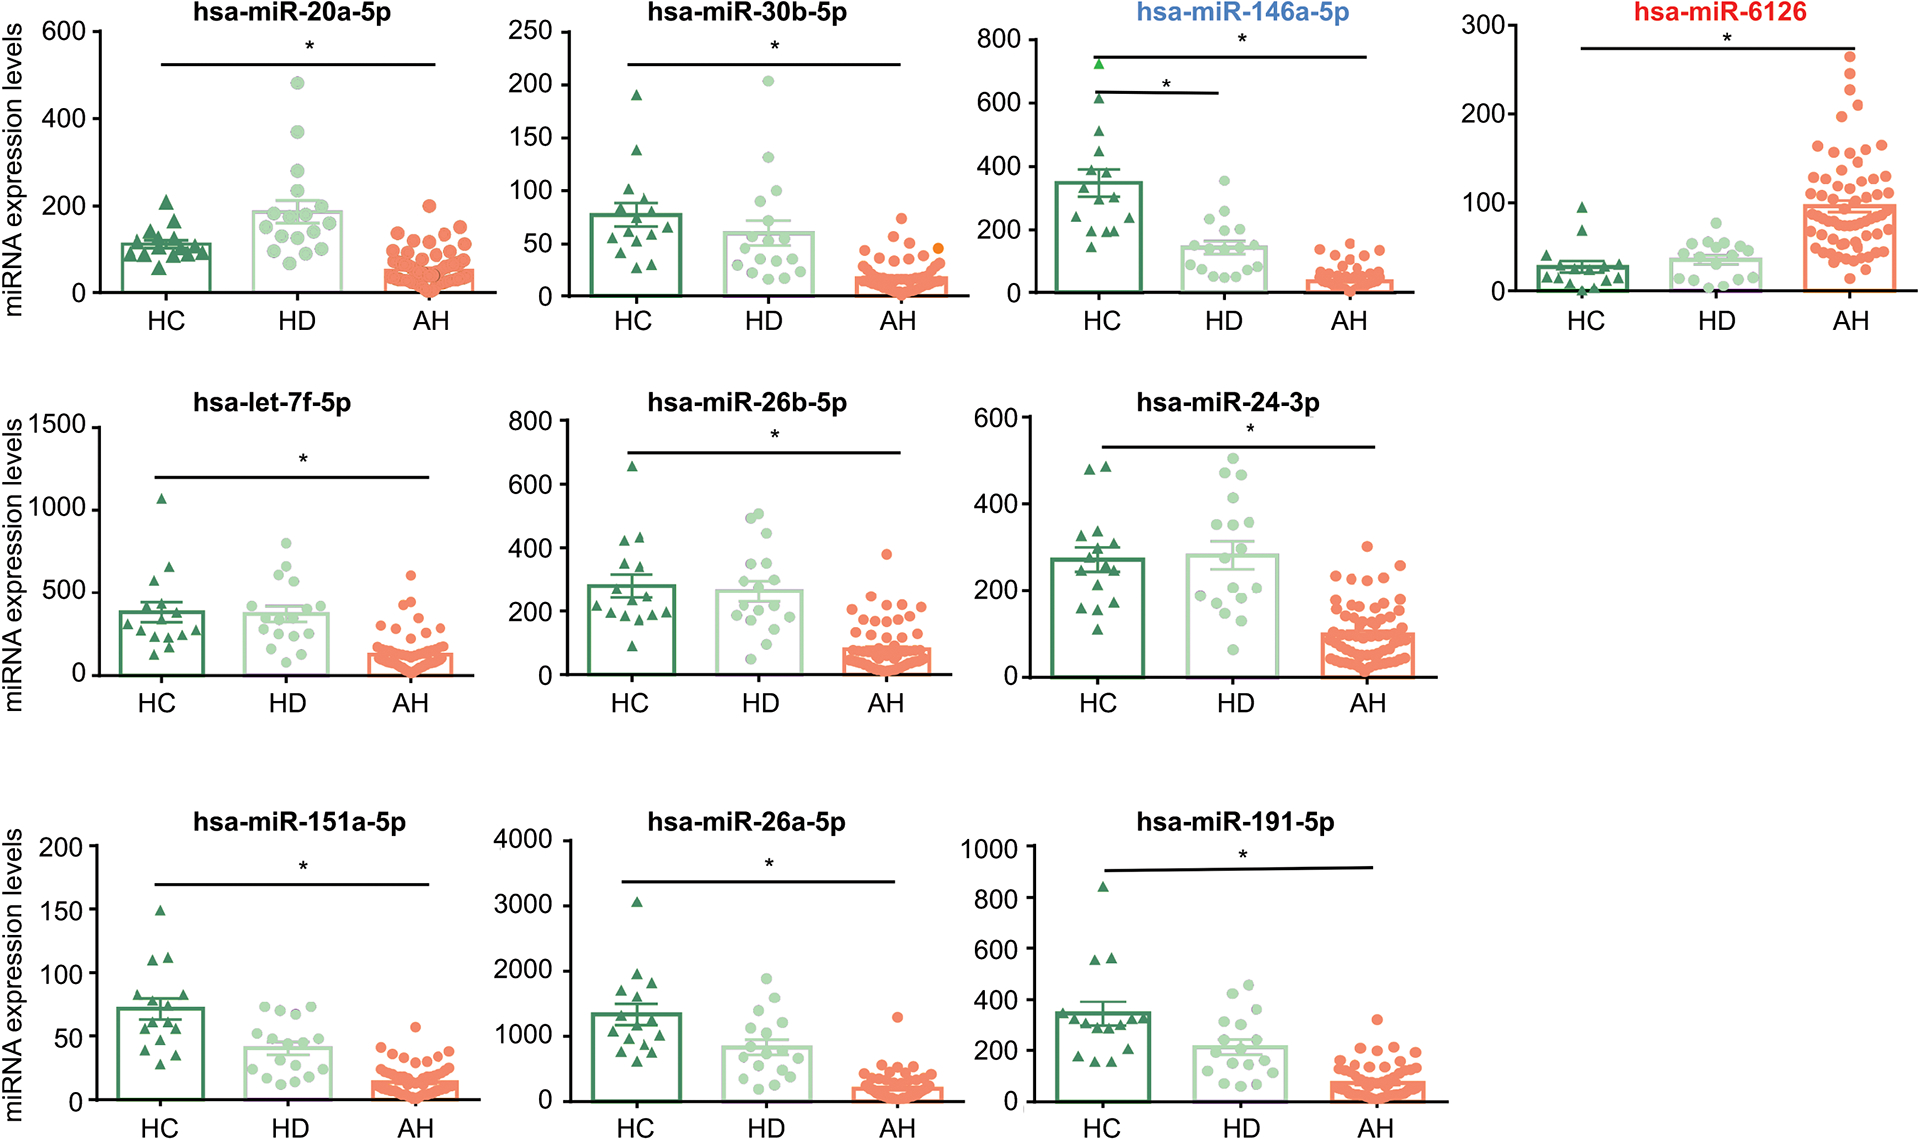
Fig. 2. The relative expression level of the indicated miRNAs based on the microarray reads.

Only Hsa-miR-6126 (in red) was significantly increased in the AH group compared to the HC group. The remaining miRNAs were significantly decreased in patients with AH. Hsa-miR-146a-5p-5p (in blue) was reduced in both HD and AH groups. *: p<0.05 vs HC.
