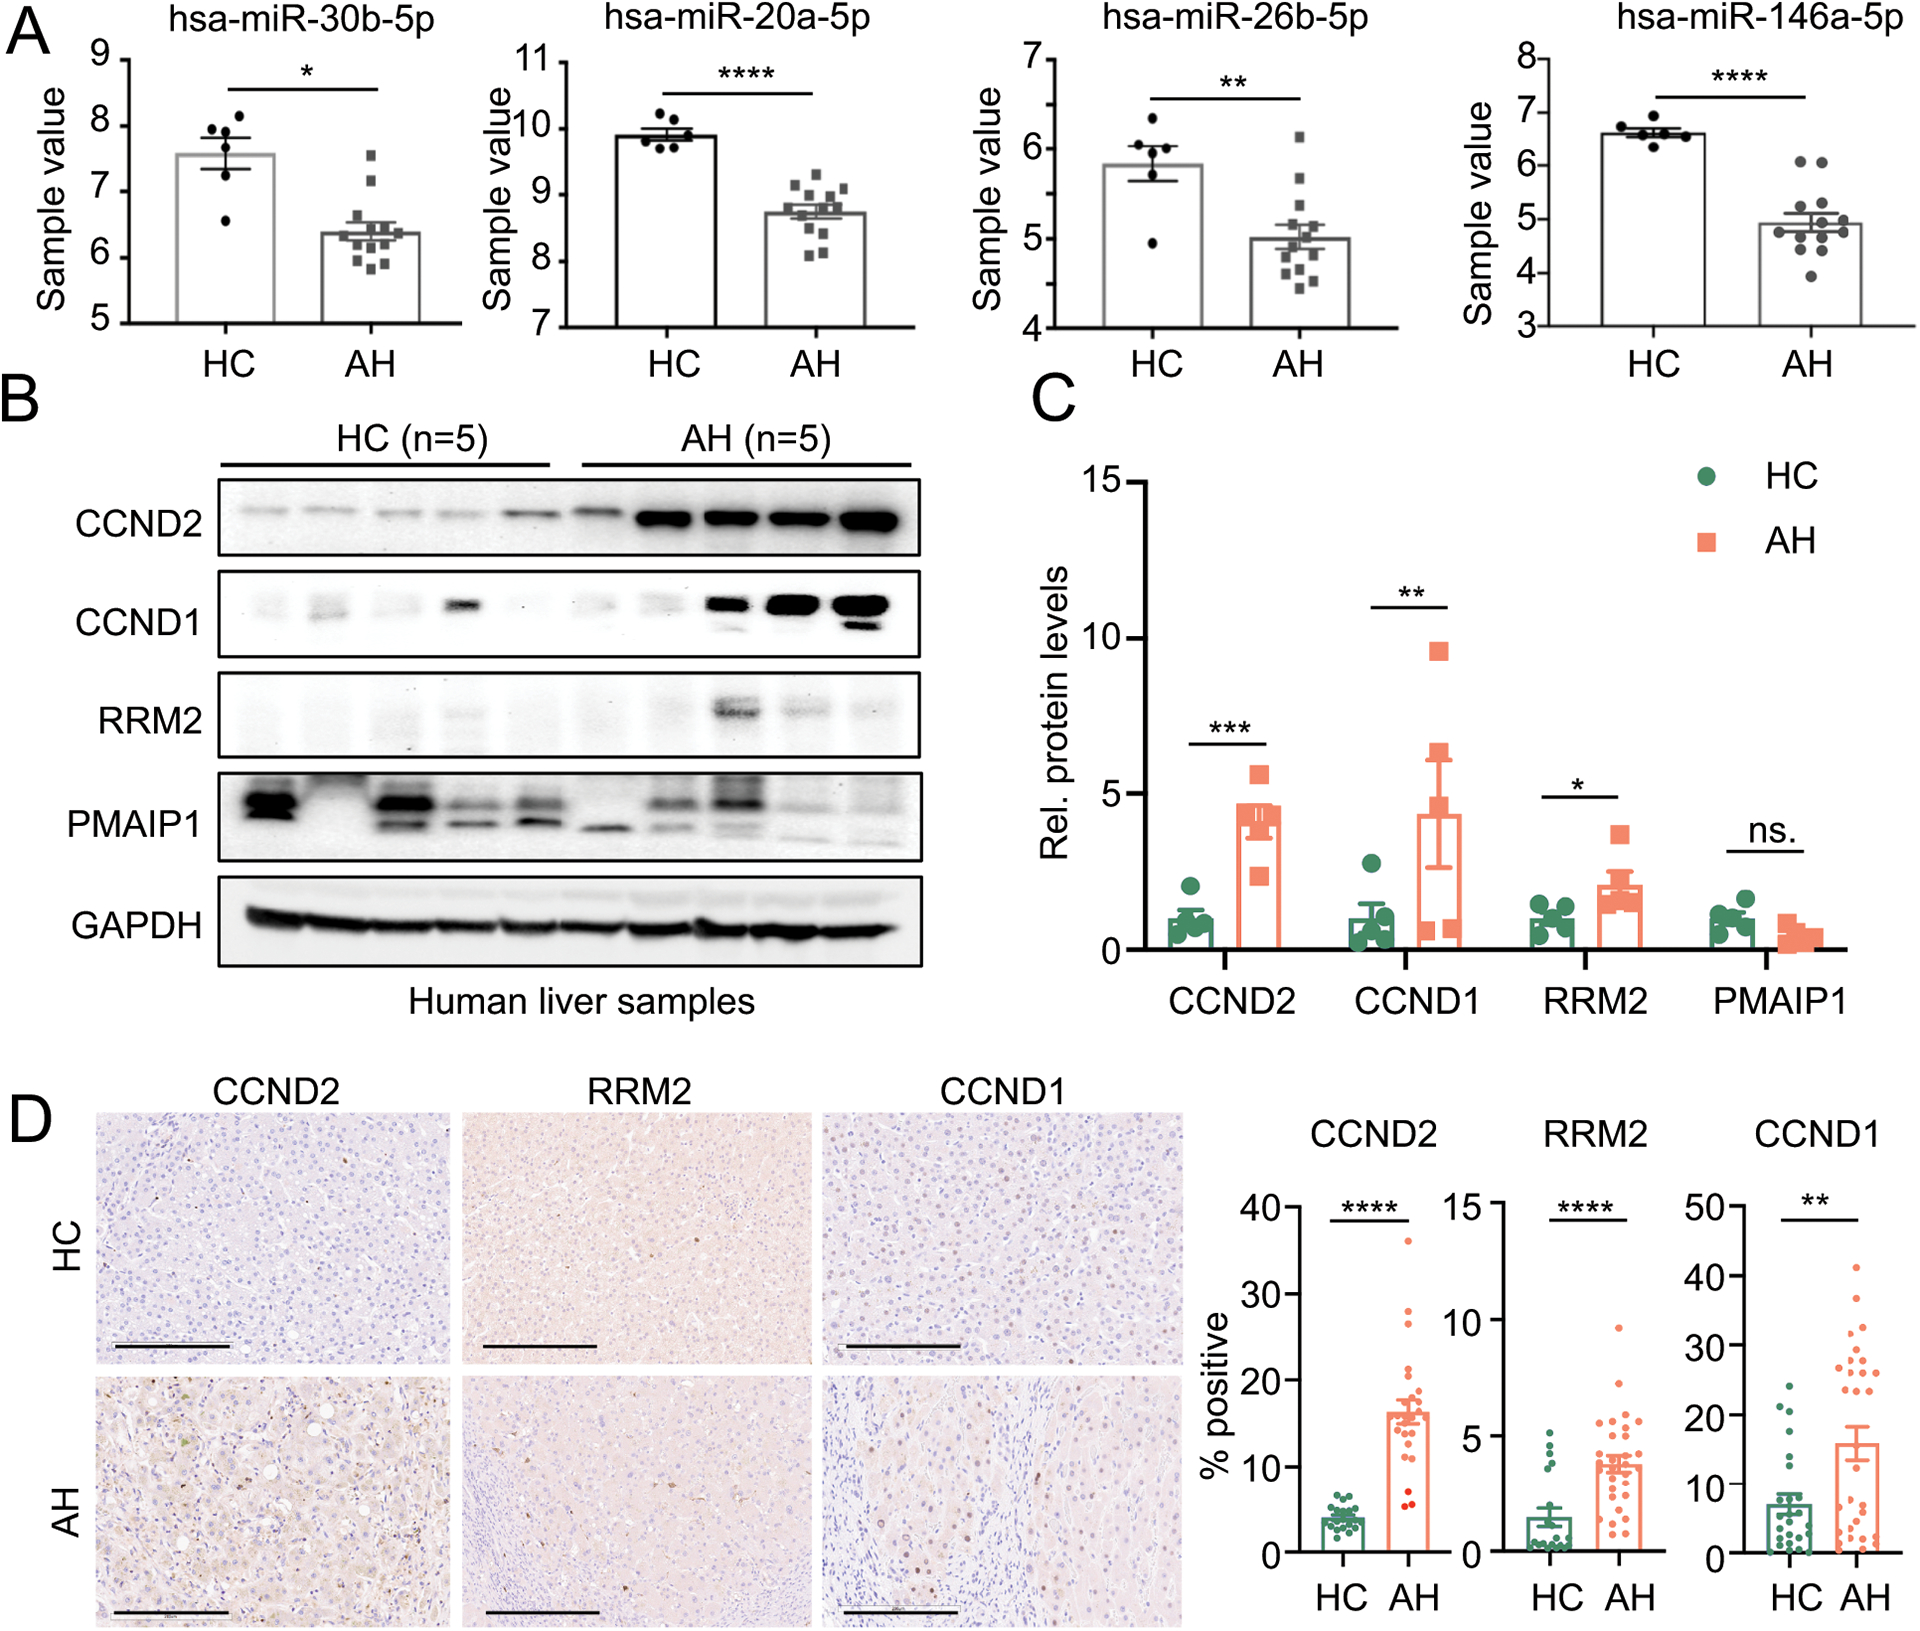
Fig. 4. The expression levels of the selected miRNAs and their targets in the liver of patients with AH.

(A) The selected miRs levels in control and AH liver samples from published RNA-seq dataset (GSE59492). (B–C) The representing western blot images and quantifications of selected targets using 5 samples in each group. (D) The representing IHC images and quantification of CCND2, RRM2 and CCND1. Scale bar: 300μm. *p<0.05; **p<0.01; ***p <0.001; ****p <0.0001 vs HC.
