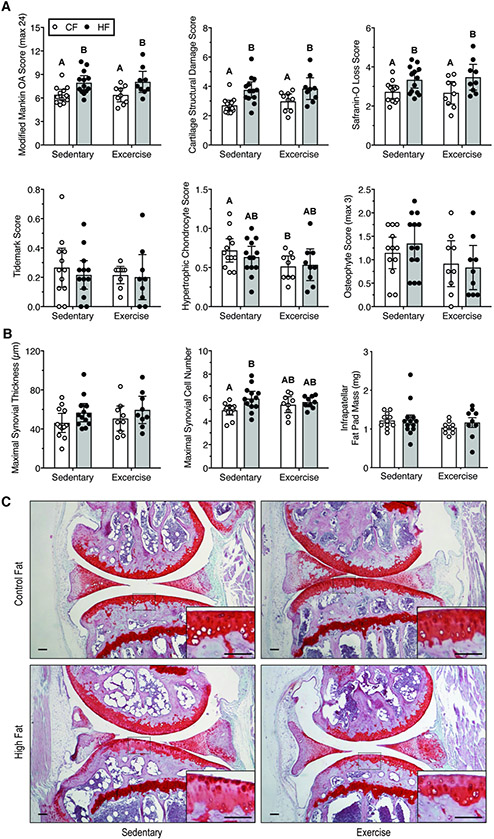
Figure 3. Effect of HF diet and voluntary wheel running on knee OA pathology.
A. Semi-quantitative OA histopathology scores. Scoring was conducted by two blinded graders throughout the joint (medial and lateral, tibia and femur). Modified Mankin scoring is the summation of cartilage damage, safranin-O loss, tidemark duplication, and hypertrophic chondrocyte scores. Data points are values for individual animals, and bars are mean +/− 95% CI. Significant differences between groups are indicated by bars that do not share a common letter (2-factor ANOVA, p<0.05, followed by Fisher’s LSD post-hoc, p<0.05). B. Quantitative synovial thickness, cell layer number, and infrapatellar fat pad mass as biomarkers of joint inflammation (mean +/− 95% CI; statistical analyses as in panel A). C. Representative histological sagittal images from the medial compartment. Inset shows a magnified view of the tibial plateau as indicated by dashed rectangle. Scale bars are 100 μm.

