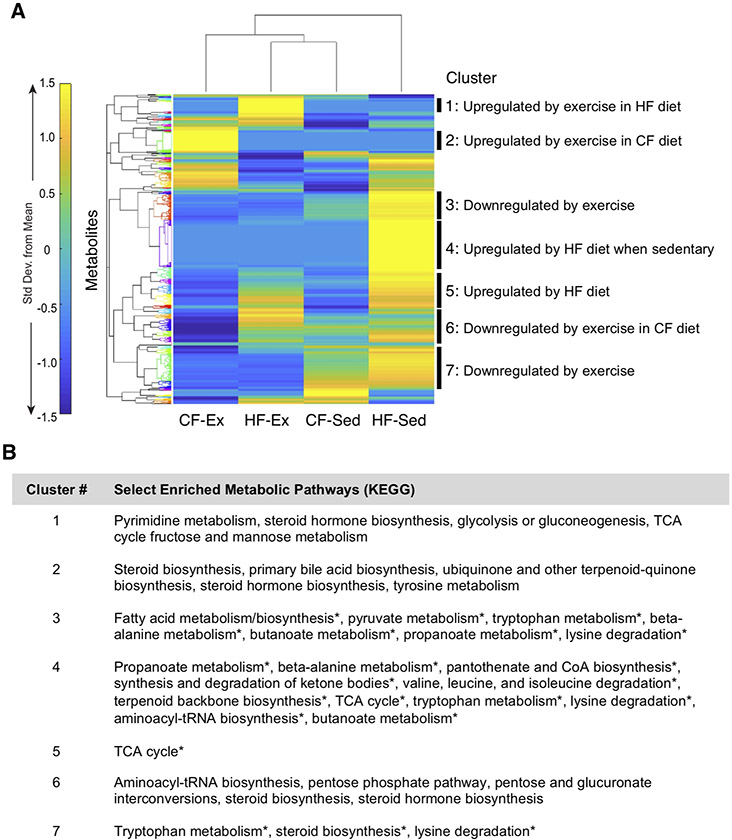
Figure 5. Effect of diet and activity on global metabolomic features in mouse synovial fluid (SF).
A. Heatmap cluster-gram visualization of unsupervised hierarchical cluster analysis (HCA) based on median intensities for all 1412 detected metabolite features. HCA revealed that the most similar synovial fluid metabolomic profiles are from CF-Sed and HF-Ex mice. HF-Sed mouse synovial fluid had the most distinct metabolomic profile. Clusters of co-regulated metabolites were selected for pathway analysis based on a minimal number of metabolite features and observable separation by Euclidean distance. B. Metabolic pathways for each cluster were evaluated by MS Peaks to Pathway, which employs Mummichog. Pathways with an a priori significance level of qfdr=0.05 are indicated by an asterisk. If no significant pathways were identified, the top five pathways were reported. A full enrichment analysis for heatmap clusters is reported in Supplemental Table S2.

