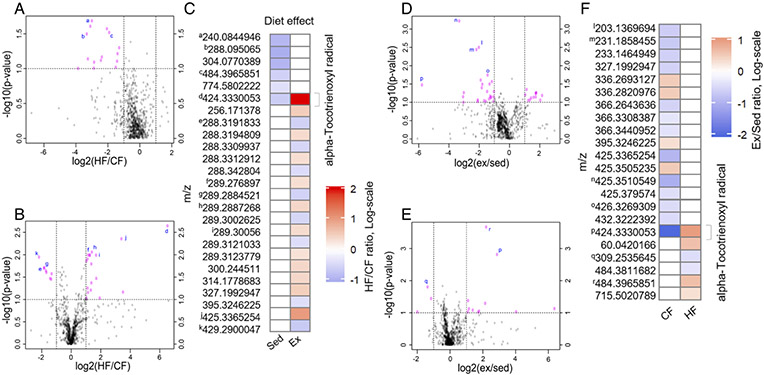
Figure 6. HF diet and wheel running interact to regulate synovial fluid metabolites.
A. Volcano plot of differentially expressed metabolite features between sedentary HF and CF cohorts. Log2(HF/CF) plotted against −log10(FDR-corrected Student’s T-test p-value) to illustrate both significance and magnitude of change. Vertical dashed lines indicate 2-fold change and horizontal lines indicate Pfdr<0.1. B. Volcano plot of differentially expressed metabolite features between Exercise HF and CF cohorts. C. Heatmap of mean metabolite levels showing significantly up (red) or down (blue) regulated metabolites due to HF (p<0.05). Annotated metabolite derived from the Human Metabolome Database. D. Volcano plot of differentially expressed metabolite features between CF Exercise and sedentary cohorts. E. Volcano plot of differentially expressed metabolite features between HF Exercise and sedentary cohorts. F. Heatmap showing significantly up (red) or down (blue) regulated metabolites due to exercise (p<0.05). Superscript letters indicate identical metabolites between volcano plots and heatmaps.

