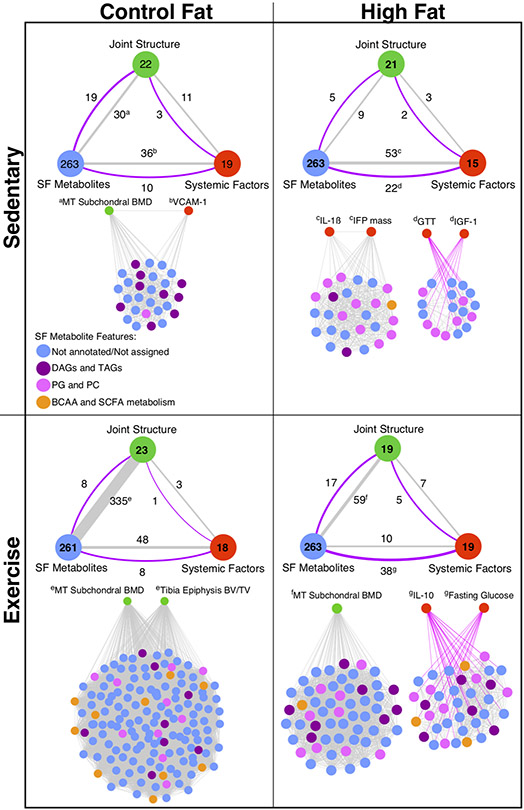
Figure 7. Correlation-based network analysis models.
Network models show distinct effects of HF diet and voluntary wheel running exercise on connectivity between systemic and local metabolic factors on joint structure. To help with interpreting the overall network for each diet and activity experimental group (Figure S5), network variables were categorized into one of three sub-group nodes: Joint Structure, SF Metabolites, or Systemic Factors. The number of variables with ≥1 significant correlations (r>∣±0.5∣ and qFDR<0.05) are shown in the large circles for each designated sub-group node of network variables, which are provided in Table S3. The number of correlated pairs of variables connecting the sub-groups are shown adjacent to the lines, whose thickness was proportional to the positive correlations (grey lines) and negative correlations (purple lines). Superscript letters indicate the primary network modules linking the indicated sub-groups to SF metabolites. Unabridged networks for each diet and activity group are shown in Figure S5. DAG: diacylglycerols; TAGs: triacylglycerols; PG: phosphatidylglycerol; PC: phosphatidylcholine; BCAA: branched chain amino acids; SCFA: short chain fatty acids.

